

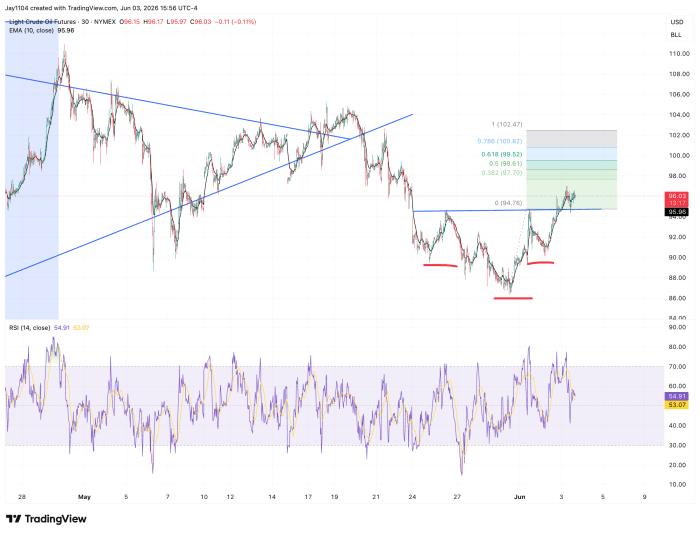
The S&P 500 finished the day lower by roughly 60 basis points, while oil prices rose by more than 2%. WTI appears to be forming an inverse head-and-shoulders pattern and, more importantly, has already broken above its neckline. If the pattern completes, it would suggest that oil prices could rise to around $102.
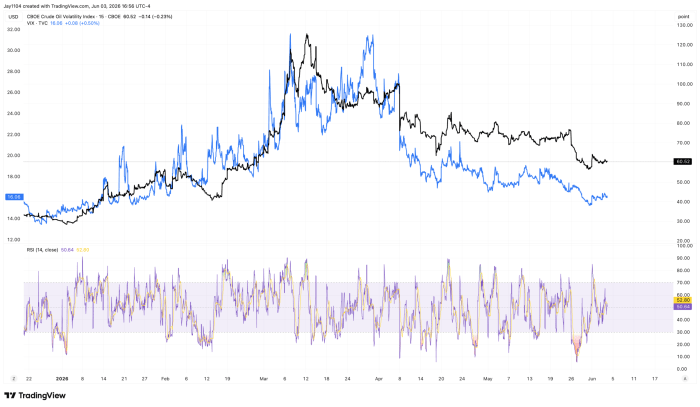
Meanwhile, volatility did not change much overall, even though the VIX rose slightly and the VIXEQ declined somewhat. However, we did see implied volatility in oil increase modestly today, though it remains stubbornly elevated.
Currently, 21-day realized volatility in oil is around 47.7%, which means oil has been moving by roughly 3% per day over the past month. Meanwhile, the OVX is trading around 60.5, implying daily moves of approximately 3.8% over the next month.
In other words, the options market is pricing in larger moves ahead than those seen over the past month, suggesting traders expect oil volatility to remain elevated for the foreseeable future.
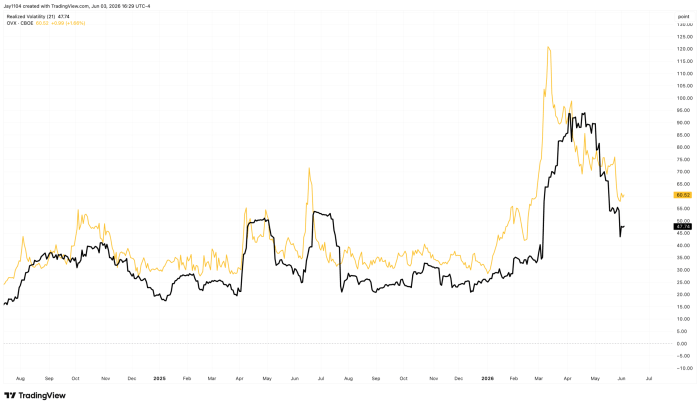
Meanwhile, the ratio of the VIX to the OVX remains elevated at around 3.8 and has shown little sign of declining. Given how much oil implied volatility has already fallen from its recent highs, the fact that the ratio has remained so elevated suggests that the decline in the VIX has largely mirrored the decline in oil volatility. In other words, equity volatility has not become materially cheaper relative to oil volatility, despite the significant retracement in the OVX.
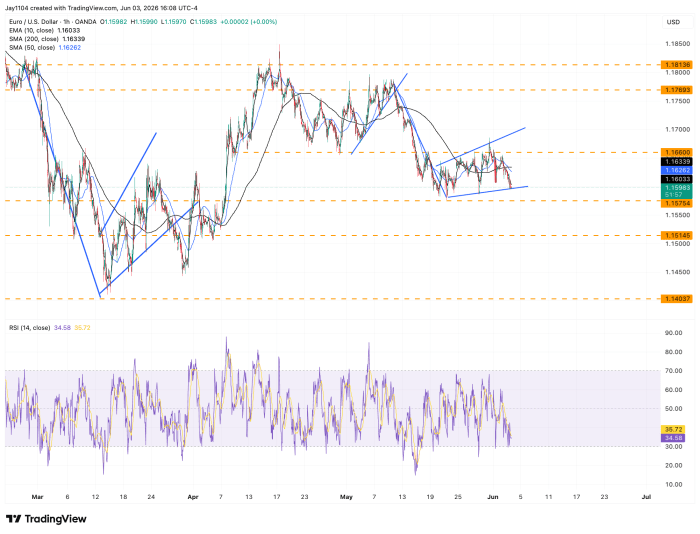
This, along with a better-than-expected JOLTS report yesterday and a solid ADP report today, helped strengthen the dollar against the euro. The EUR/USD appears poised to weaken further, forming what looks like a bear flag pattern. In this case, a break below support around 1.155 would likely trigger a move initially lower toward 1.151.
The put wall in the S&P 500 was around 7,550 today, helping support the market. However, based on current positioning, the put wall could shift lower tomorrow, potentially moving to around 7,200. If that occurs, the S&P 500 could slip back into a negative gamma regime, which would likely be less supportive of market stability and could contribute to increased volatility.
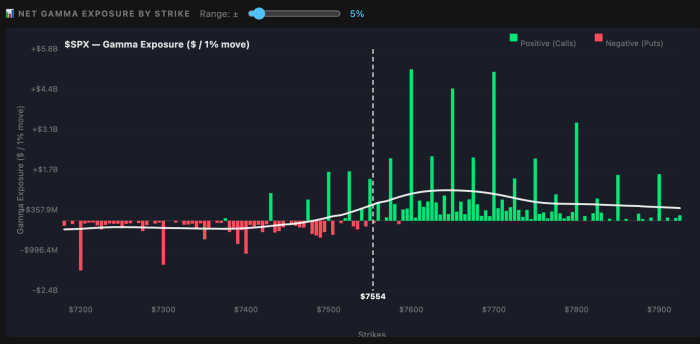
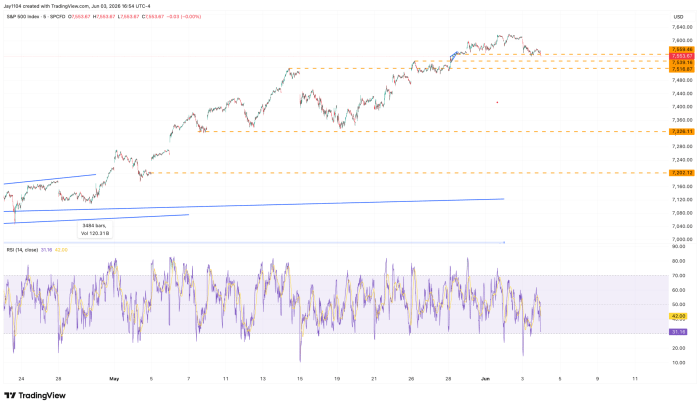
The technical chart already reflects much of this, with support concentrated between 7,500 and 7,550. However, below 7,500, support begins to thin out considerably until around 7,350, suggesting that a break of that level could leave the index more vulnerable to a sharper decline.
On top of that, index volatility remains relatively low, and if oil volatility rises, it will likely pull the VIX higher as well. That combination could create the conditions for a meaningful market pullback, particularly if volatility rises as support levels begin to give way.
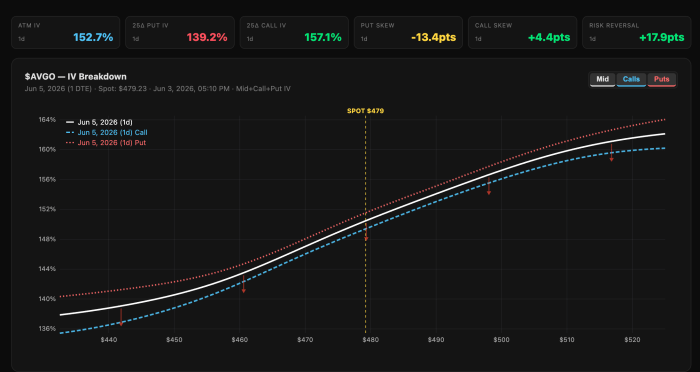
There is a chance of that as well, especially with Broadcom (AVGO) trading roughly 15% lower after hours following its earnings results. Implied volatility for Friday had risen to around 150% ahead of the report, and the skew was heavily tilted toward a higher price, with an upward-sloping volatility curve. In other words, upside exposure was being priced much more aggressively than downside risk.
As a result, we are seeing the typical post-earnings dynamic, where call options are getting hit particularly hard as implied volatility collapses and the earnings risk premium is removed from option prices.
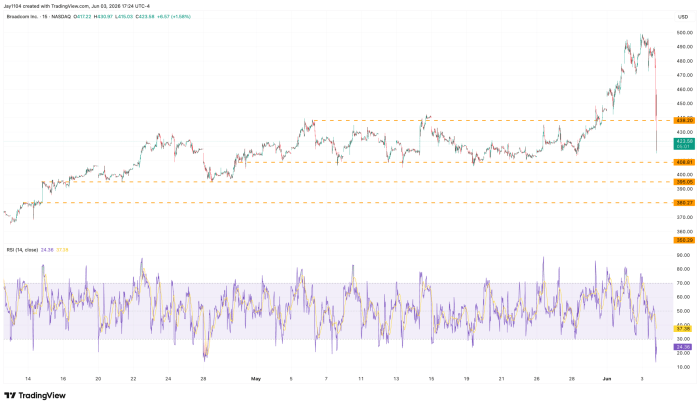
The stock has a put wall at $380, so there could still be some pain ahead depending on how the conference call unfolds. For now, the key area to watch is the $430-$440 gamma-flip zone. If the stock can find support there, it may help stabilize the price action. However, a failure to hold that region could increase the risk of a deeper decline toward lower support levels.
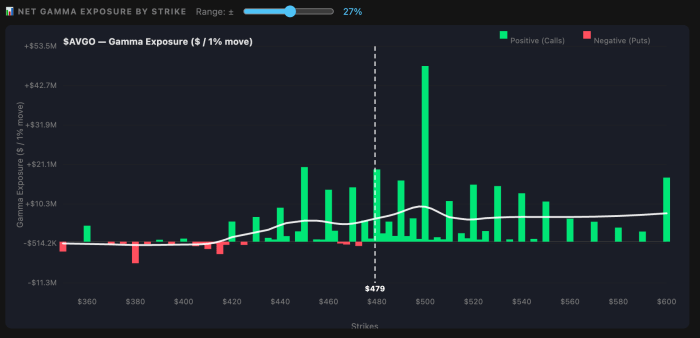
The chart suggests that if $440 fails to hold, the next area of support comes in around $410. Below that, the next meaningful technical support level is near $395. As a result, a break below $440 could leave the stock vulnerable to a move lower as it searches for the next area of support.
A bit longer than usual, but I guess I was feeling generous when it came to the Broadcom analysis.


Comments
Log in or sign up to join the conversation.