


The rally in Nvidia (NVDA) today lifted the S&P 500, with nearly all of the index’s gains on the day attributable to Nvidia, at least based on my calculations. The equal-weight S&P 500 ETF (RSP) finished the day lower by 30 bps, versus a 72 bps gain for the S&P 500. I was surprised by Nvidia’s move above the $220 call gamma level, which was rather large. However, the $230 call wall held as resistance, and that is the major test for the stock going forward. A failure to push above $230 would likely result in the shares giving back today’s gains over time. Above $230, flows begin to shift, which could lead to the shares accelerating higher.
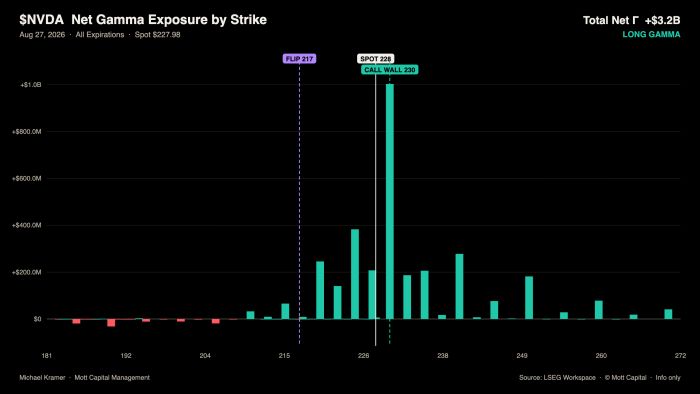
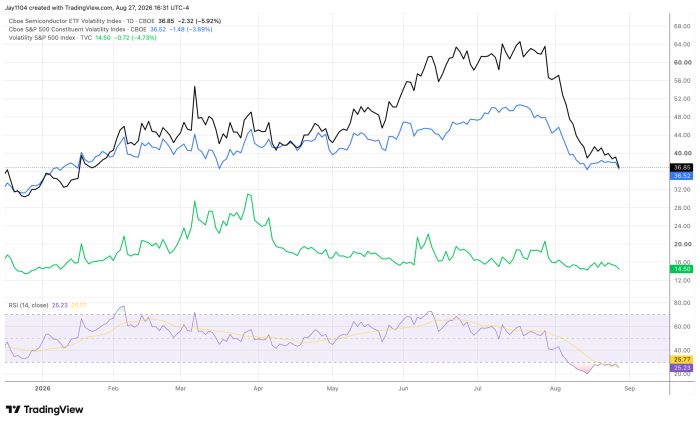
It is not a surprise, though, that with Nvidia having reported results, implied volatility melted lower across single-stock and semiconductor vol. This is important because, with Nvidia’s results now behind us, whatever was left of the dispersion trade is pretty much over, with only Broadcom (AVGO) remaining at this point. The dispersion index should continue to unwind.
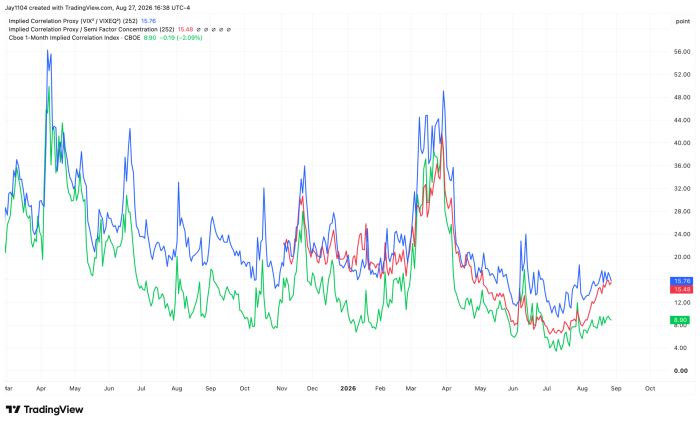
Normally, when dispersion unwinds, we expect correlations to rise, and that has been happening very slowly, with the implied relationship between semiconductor and S&P 500 volatility steadily rising. The one-month implied correlation index has also been steadily rising, but to this point, the move has been calm and gradual. This tells us, first, that the market is not in a position to absorb a macro shock; such a shock would likely result in a pretty violent reset. Yet index volatility remains fairly inexpensive — which is the mispricing.
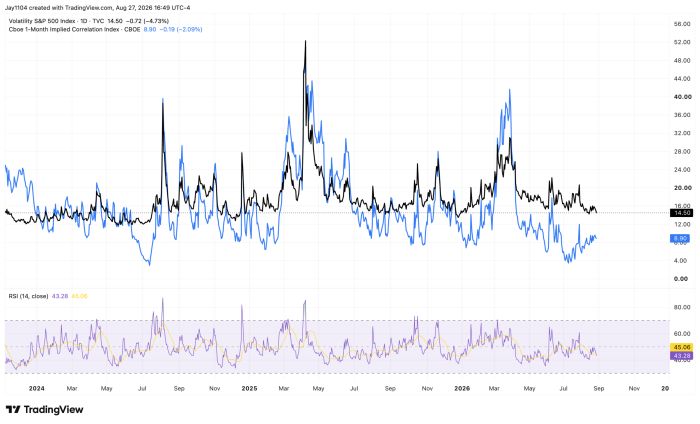
Second, the more dispersion unwinds, the more likely it is that correlations rise, and the more likely it becomes that, at some point, this feeds back into a rising VIX. Right now, the VIX has been falling even as correlations have been rising.
In the end, though, these are implied levels, reflecting where the market is pricing both implied correlations and dispersion to go. The problem is that it hasn’t actually happened yet. We are just starting to see realized dispersion unwind and realized correlations rise. So, in essence, the options market has skated to where it thinks the puck is going — stocks converging and the index waking up. The puck is just starting to move.
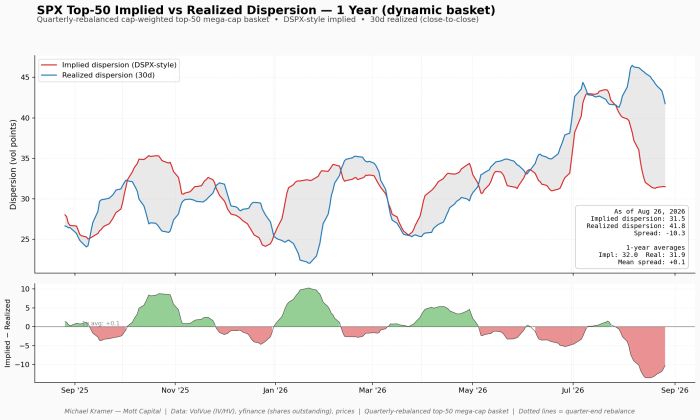
One would think that, from this point forward, realized dispersion comes down and stocks start trading more in line with one another again, allowing moves that the semiconductor AI trade has been masking to finally show up at the index level.


Comments
Log in or sign up to join the conversation.