


Three years of SEC 10-K capital allocation — same industry family, two very different uses of free cash.
Most semiconductor debates stop at margins or “who has the better AI story.”
A quieter question is more revealing:
When free cash flow finally shows up, what does management actually do with it?
Here is Nvidia vs Micron over their last three annual 10-K periods (USD billions, SEC filings only — no quarterly noise).
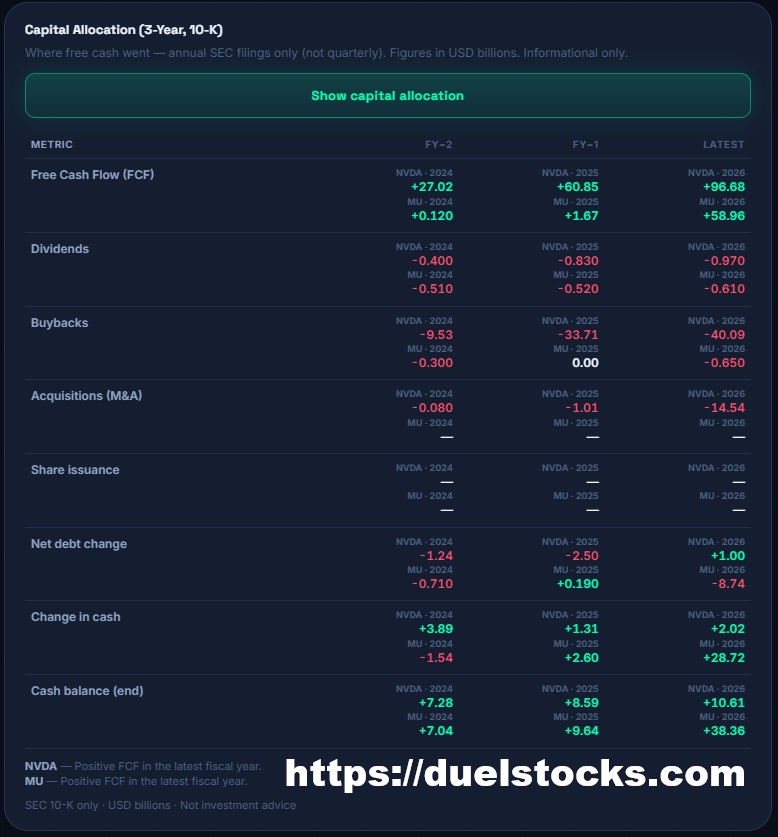
Free cash flow
NVIDIA’s FCF was already large and kept compounding.
Micron’s latest year is the story: from almost nothing to ~$59B. That is a cycle turn written in cash, not in a press release.
What they did with it
Shareholder returns
NVDA — small dividend, massive and rising buybacks (−9.5 → −33.7 → −40.1).
MU — small, steady dividend (~0.5–0.6); buybacks almost absent (−0.3 / 0 / −0.7).
Balance sheet
NVDA — modest net-debt moves; cash climbed 7.3 → 10.6. Latest year also shows a large M&A check (−14.5).
MU — heavy debt paydown in the latest year (−8.7 net debt) and a cash surge: change in cash +28.7, ending cash 38.4 (from ~7–10 the prior years).
No material share issuance on either side in the tagged data. MU shows no material M&A line.
How to read the two strategies
This is not “who is the better stock.” It is capital allocation regime:
Nvidia — mature cash engine. Convert FCF into aggressive share reduction, selective M&A, and a slowly rising cash buffer.
Micron — post-cycle repair. When FCF returned, priority was clear: delever + stockpile cash, not max the buyback. Classic memory-industry discipline after a trough.
Same broad sector. Opposite order of operations once the cash appears.
Why the ledger matters
Income-statement quality (margins, ROIC, Sloan) answers: is the earnings real?
The capital-allocation table answers: where did the cash go?
A company can print a spectacular FCF year and still:
lever up,
overpay for deals, or
leave equity holders waiting while the balance sheet heals.
Or it can do what MU did here: use the upcycle to strengthen the fortress first.
You can open the same three-year, 10-K-only view for any pair:
(Example: NVDA vs MU)
Data from annual SEC filings only. Informational — not investment advice.



Comments
Log in or sign up to join the conversation.