


The headline score of 67–33 in favor of Micron Technology (MU) over Accenture (ACN), generated by the algorithmic breakdown at here, suggests a decisive fundamental victory. However, the underlying data reveals a nuanced tension between explosive cyclical expansion and durable, albeit slower, operational consistency. This comparison centers not merely on top-line acceleration, but on the structural quality of that growth and the sustainability of each company's financial architecture. The core analytical question is whether Micron’s recent metrics represent a permanent step-change in profitability or a cyclical peak showing signs of accrual-driven distortion, while Accenture’s modest figures mask a deeper operational resilience.
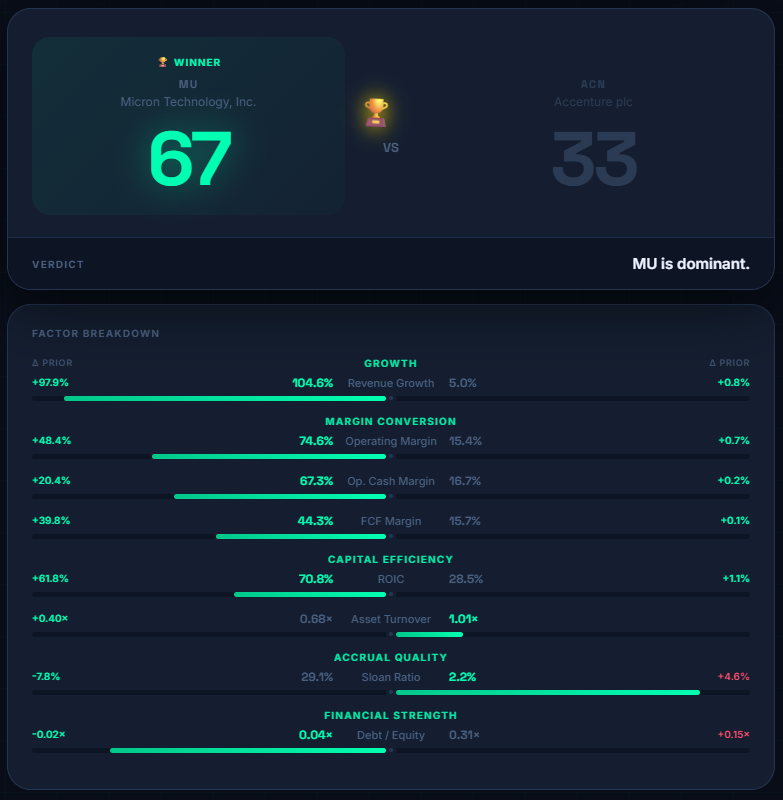
At first glance, Micron’s year-over-year revenue growth of 104.65% is staggering, heavily outpacing Accenture’s 4.98%. This massive expansion is accompanied by a surge in operating margin to 74.59%, representing a 48.4 percentage point increase from the prior filing. Micron's trend report describes these changes as mutually reinforcing, noting that operating, cash, and free cash flow (FCF) margins improved simultaneously. This alignment typically indicates a genuine conversion of revenue into cash rather than an isolated accounting effect. A free cash flow margin of 44.27% and an operating cash margin of 67.33% support this view, demonstrating that the company is capturing substantial liquidity from its sales pipeline.
However, this aggressive growth narrative encounters structural headwinds when examining earnings quality. The Sloan Ratio—a critical metric for detecting accrual-driven earnings inflation—sits at 29.07% for Micron. While the delta shows a -7.8% improvement versus the prior filing, the absolute level remains elevated, especially when juxtaposed with Accenture’s 2.23%. A Sloan Ratio of this magnitude signals that a considerable portion of Micron’s reported income may derive from non-cash accruals rather than operational cash flow. This introduces a conflict within the resilience framework: while Micron’s Return on Invested Capital (ROIC) reached an impressive 70.85%, the system flags this as a risk because the high return is not fully supported by accrual quality. The data implies that Micron’s current profitability profile is robust in cash terms but vulnerable to earnings inflation—a characteristic typical of cyclical commodity peaks, where inventory revaluations or accounting shifts can inflate reported margins without corresponding cash inflows.
Accenture, by contrast, presents a narrative of disciplined consistency. Its operating margin of 15.38% and FCF margin of 15.66% are lower than Micron’s, but they are backed by a much healthier 2.23% Sloan Ratio. The trend report for Accenture notes a degree of caution: while ROIC increased, the Sloan Ratio worsened by 4.6 percentage points. This divergence suggests that Accenture’s recent return gains may be partially accrual-driven, but the baseline quality of its earnings remains significantly higher than Micron's. The key takeaway is that Accenture’s profit recognition aligns tightly with actual cash generation, reducing the risk of future earnings revisions.
Balance sheet dynamics further differentiate the two firms. Micron’s Debt/Equity ratio is a remarkably low 0.04x, down 0.02x from the prior filing, indicating a near-debt-free position that provides a strong financial cushion. This is reinforced by a Cash-to-Debt Coverage ratio of 24.73x, far exceeding the 1.0x benchmark. Accenture’s Debt/Equity ratio is higher at 0.31x, though it maintains a solid Cash-to-Debt Coverage of 2.49x. Both companies pass the liquidity runway benchmark, with Micron showing a 1.0-year runway and Accenture demonstrating an infinite runway due to its predictable cash flows. However, Micron’s liquidity runway score of 16 (out of 100) is notably lower than Accenture’s 100, highlighting a potential vulnerability in cash buffer duration despite low nominal debt levels. This suggests that while Micron possesses ample cash relative to its tiny debt load, its cash position remains highly volatile and dependent on the continuation of its current high-margin cycle.
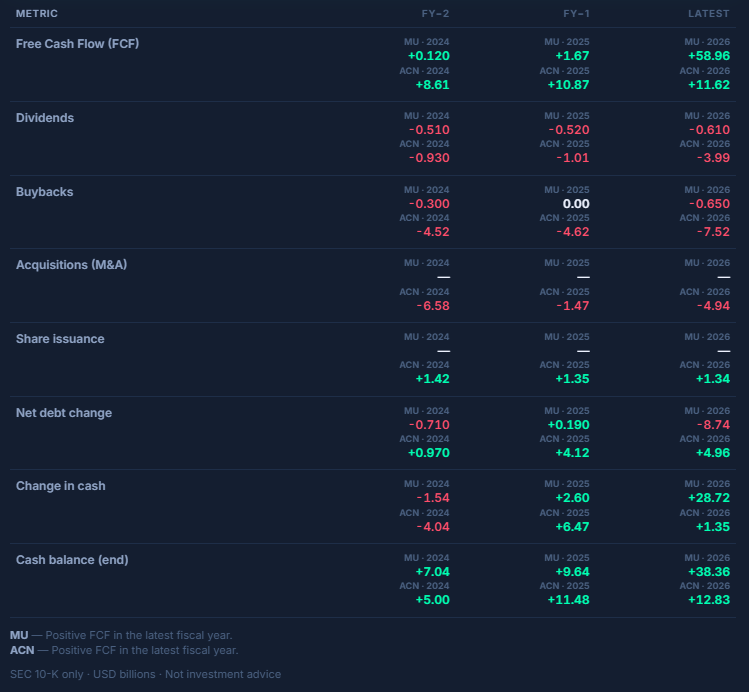
Capital allocation patterns reflect distinct strategic priorities. Micron’s free cash flow surged to $58.96 billion in the latest period, up from $1.67 billion in the prior year, tracking its massive expansion in profitability. However, its capital allocation reveals a shift toward shareholder distributions, deploying $0.61 billion to dividends and $0.65 billion to buybacks, with no acquisitions reported. This points to a strategy of returning excess cash to shareholders during a peak cycle. Accenture, generating an FCF of $11.62 billion, is more aggressive in its corporate development, spending $7.52 billion on buybacks, $3.99 billion on dividends, and $4.94 billion on acquisitions. This active M&A activity, combined with share issuance of $1.34 billion, underscores a dual strategy of organic and inorganic expansion. Consequently, Micron achieved a significant net debt reduction of $8.74 billion, whereas Accenture increased its net debt by $4.96 billion to fund its acquisitions and share repurchases.
The Discounted Cash Flow (DCF) valuation model provides a forward-looking constraint on raw growth numbers. Micron’s base growth rate is clamped at 35.00%, significantly lower than its 104.65% revenue CAGR, reflecting the model’s assumption that such explosive growth is unsustainable over the long term. The effective growth rates for the next three years are projected at 34.45%, 40.00%, and 40.00%, driven by a 1.08x FCF margin multiplier and a 1.10x ROIC multiplier. This implies that the market expects Micron to maintain high profitability, albeit at a moderating growth pace. Accenture’s base growth rate stands at 4.98%, with effective growth rates of 5.70% for the next three years, driven by a 1.04x FCF margin multiplier. Terminal growth rates are set at 3.00% for Micron and 2.49% for Accenture, reflecting long-term sustainable growth assumptions for their respective industries.
The resilience framework highlights a key divergence in cash conversion efficiency. Micron’s Earnings Quality Ratio, calculated as CFO/Operating Income, is 0.90x, indicating that cash flow lags accounting profit. This serves as a warning sign that a portion of reported income has not yet been realized in cash. Conversely, Accenture’s ratio is 1.08x, meaning its cash flow comfortably exceeds its accounting profit—a reliable indicator of earnings sustainability. Combined with the Sloan Ratio, these metrics demonstrate that Micron’s growth is impressive but potentially fragile, while Accenture’s growth is modest but robust.
In conclusion, the data supports a relative ranking where Micron leads in raw growth and margin expansion, while Accenture excels in earnings quality and operational consistency. The 67–33 score reflects Micron’s superior short-term financial performance, but the underlying metrics expose risks in its earnings quality and liquidity runway score. Accenture’s lower growth profile is offset by a more sustainable business model characterized by higher cash conversion and a stable accrual profile. The open question is whether Micron can maintain its high margins and cash conversion rates as the industry cycle normalizes, or if these figures represent a peak vulnerable to mean reversion. For investors, the choice is not between a winner and a loser, but between high-reward cyclical volatility and lower-risk operational consistency.



Comments
Log in or sign up to join the conversation.