

Several weeks ago, the Tadawul All-Share Index (TASI) went right through the 61.2% Fibonacci retracement (potential resistance) of the long-term downtrend that started off the September 2014 peak of 11,159.50 and kept going. Year-to-date the index is up 17.5%.
(Click on image to enlarge)
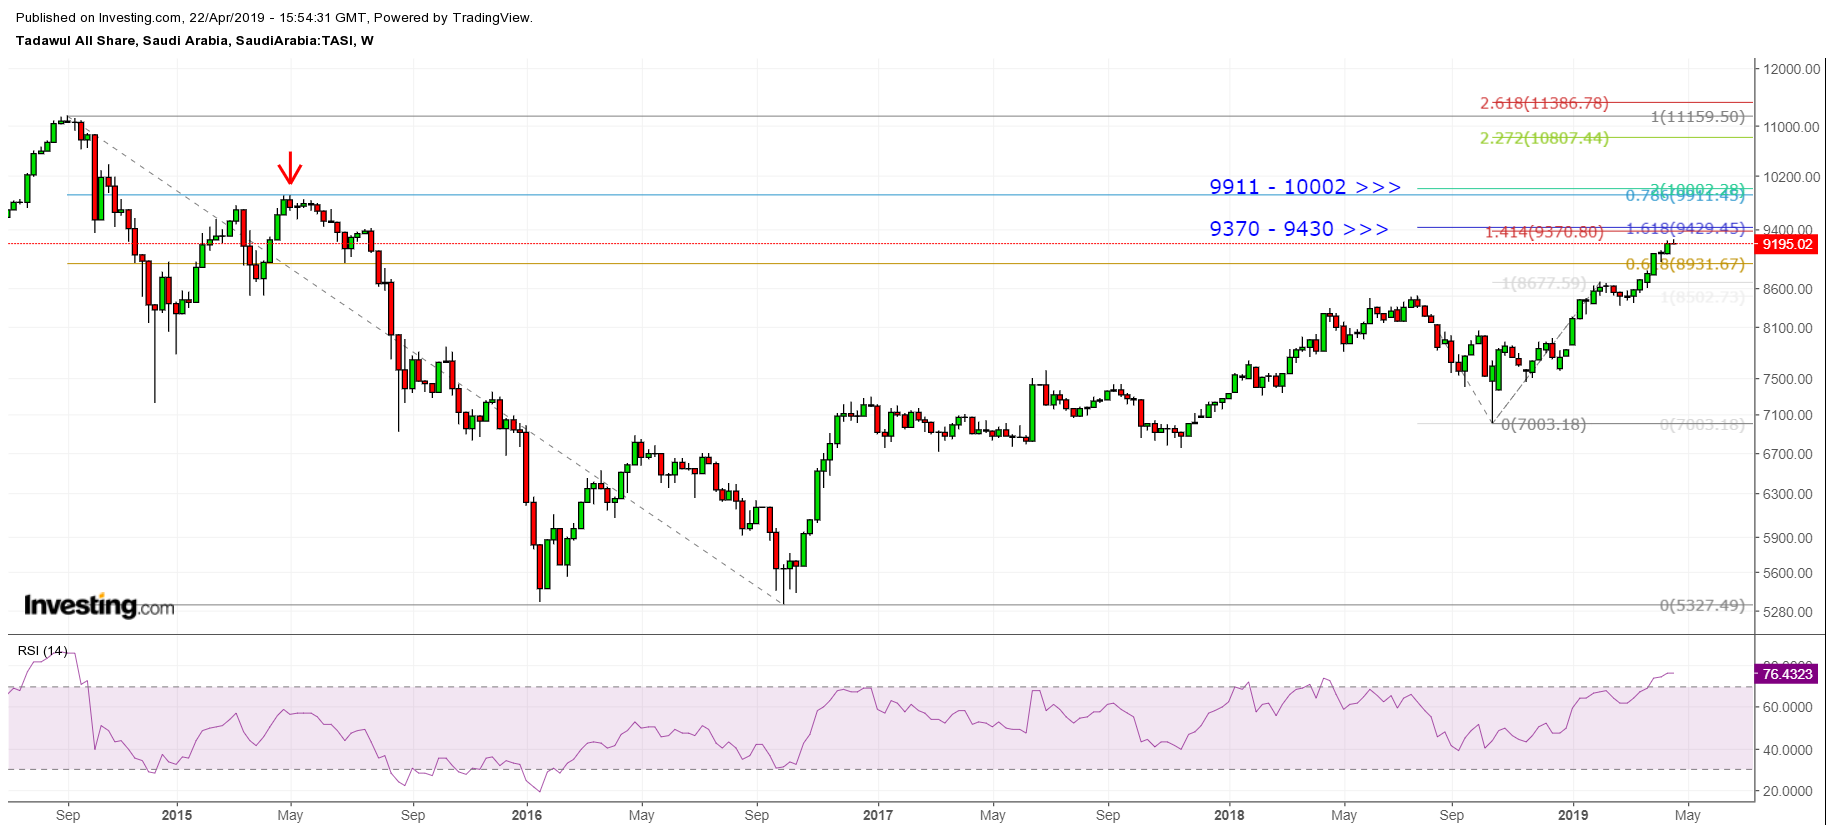
TASI – Weekly Chart
The next long-term target is around the 9,911 to 10,002, which consists of the 9,897.44 swing high resistance from way back in April 2015. Nevertheless, there is an interim potential resistance zone, comprised of two Fibonacci projection and extension measurements, from around 9,370 to 9,430. Each of these zones can be seen on the accompanying weekly chart of the TASI.
As noted in prior TASI analysis, Investors in US markets can get exposure to Saudi equities through at least two ETFs: iShares MSCI Saudi Arabia ETF (KSA) (almost 100% exposure), and Wisdom Tree Middle East Dividend Fund (GULF) (approximately 27% exposure).

Comments
Log in or sign up to join the conversation.