
A bearish daily Doji candlestick pattern occurs in Bitcoin Cash (BCH/USD) following seven days up, while a potential 1-day reversal triggered with a break below the candle’s low. This is the first time in eight days that price has dropped below the prior day’s low and is a clear change in the pattern of higher daily lows and higher daily highs.
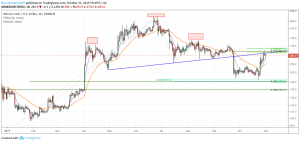
The potential topping pattern occurs in an area of potential resistance identified by:
• Neckline resistance of large bearish head and shoulder top pattern (HS).
• Area of 78.6% Fibonacci retracement of most recent swing high to low decline.
• Bearish 14-period divergence occurs on 4-hour chart.
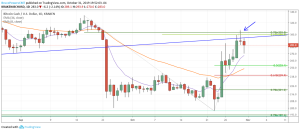
Most recent low to $196.80 was not close to reaching the measuring objective based on a percentage measurement, of approximately $144.54. Therefore, this pair has the potential to fall well below the most recent swing low. This doesn’t mean that it will, just that it could.
A move above the most recent trend high at $306.70 will negate the above potentially bearish analysis.

Comments
Log in or sign up to join the conversation.