


Our stock market chart book for August 2026 covers where things stand as summer winds down: trend, volatility, rates, liquidity, earnings, and global markets in 66 exhibits.
Trend & Technicals
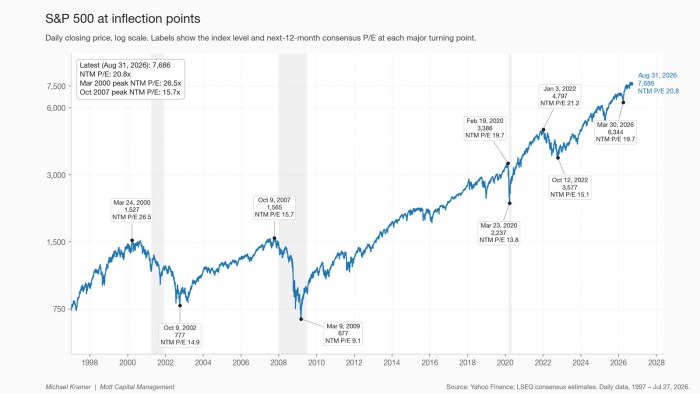
S&P 500 (SPY) at inflection points
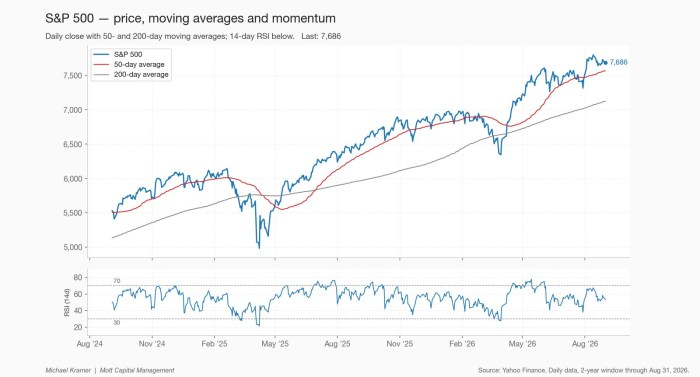
S&P 500 — price, moving averages and momentum
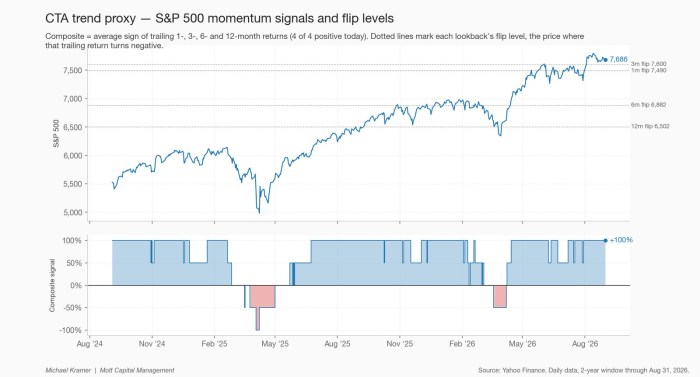
CTA trend proxy — momentum signals and flip levels
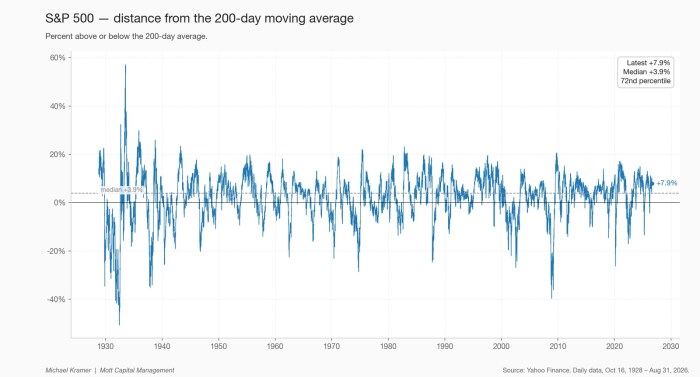
S&P 500 — distance from the 200-day moving average
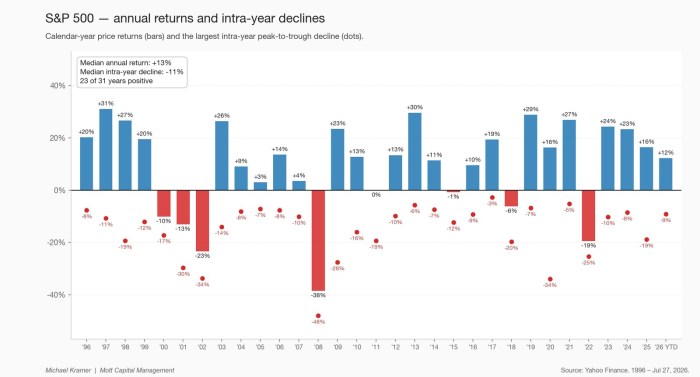
S&P 500 — annual returns and intra-year declines
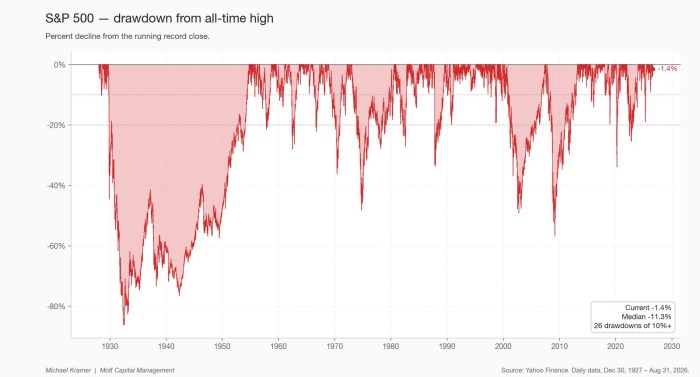
S&P 500 — drawdown from all-time high
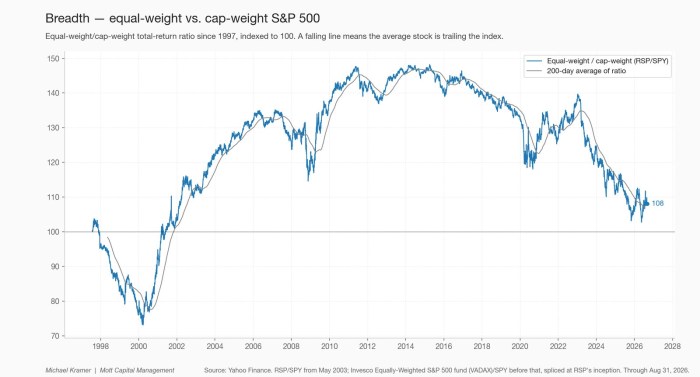
Breadth — equal-weight vs. cap-weight
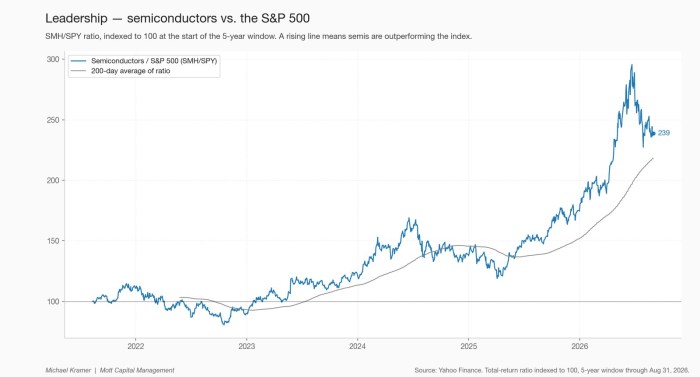
Leadership — semiconductors vs. the S&P 500
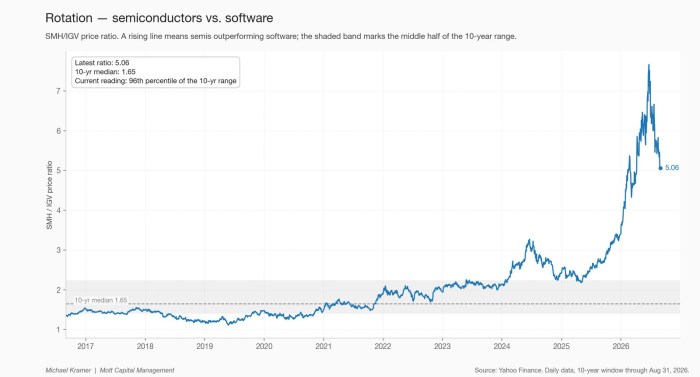
Rotation — semiconductors vs. software
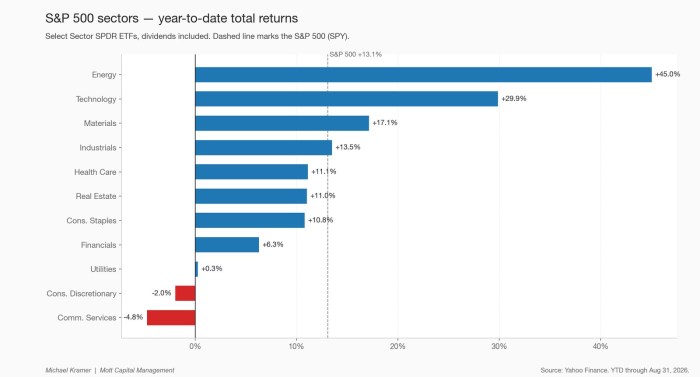
S&P 500 sectors — year-to-date total returns
Volatility & Positioning
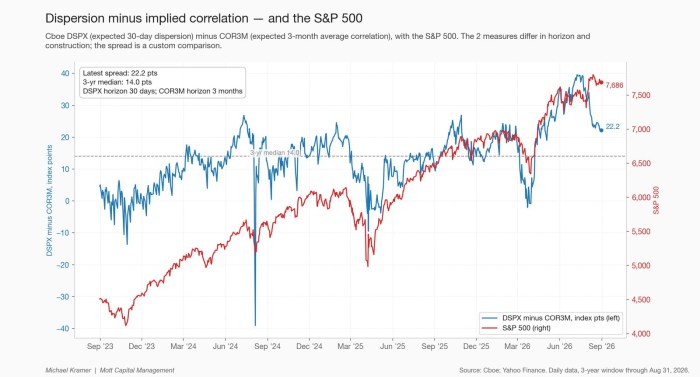
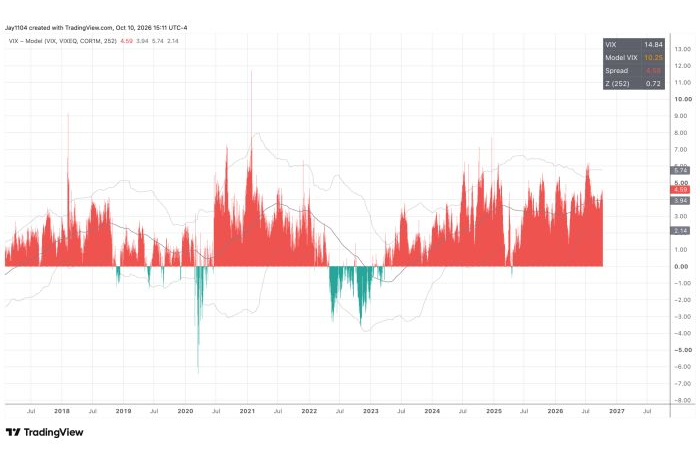
Dispersion minus implied correlation — and the S&P 500
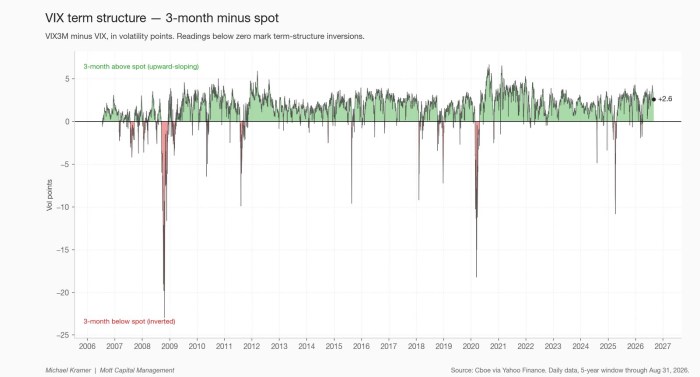
VIX term structure — 3-month minus spot
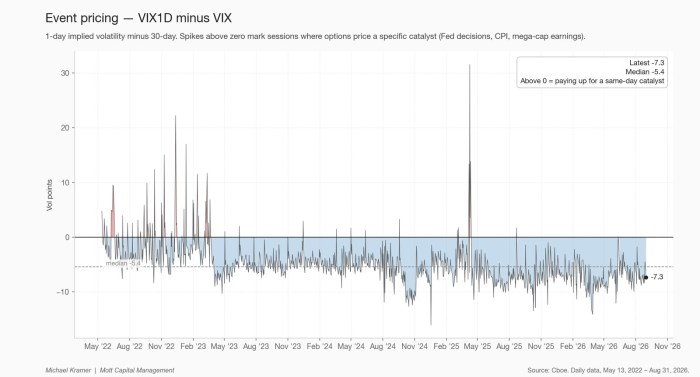
Event pricing — VIX1D minus VIX
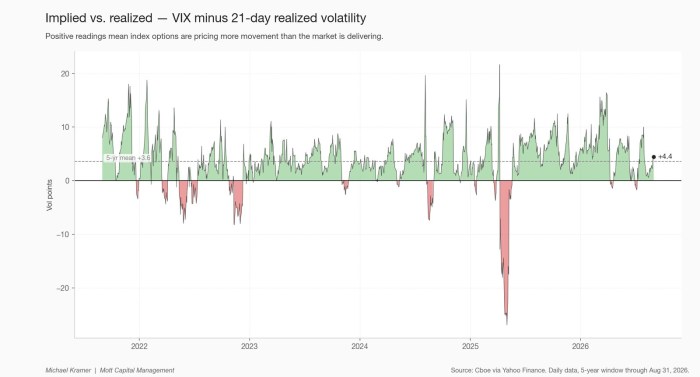
Implied vs. realized — VIX minus 21-day realized volatility
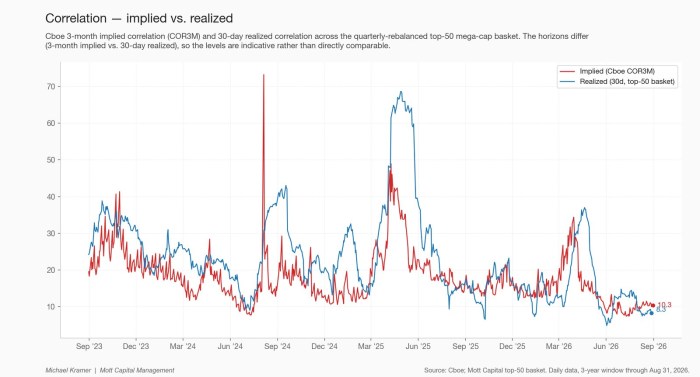
Correlation — implied vs. realized
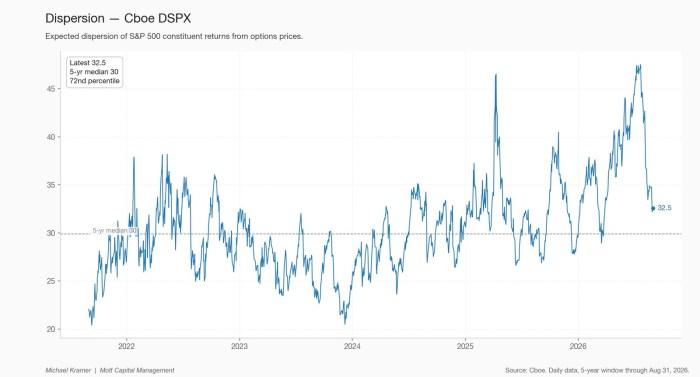
Dispersion — Cboe DSPX
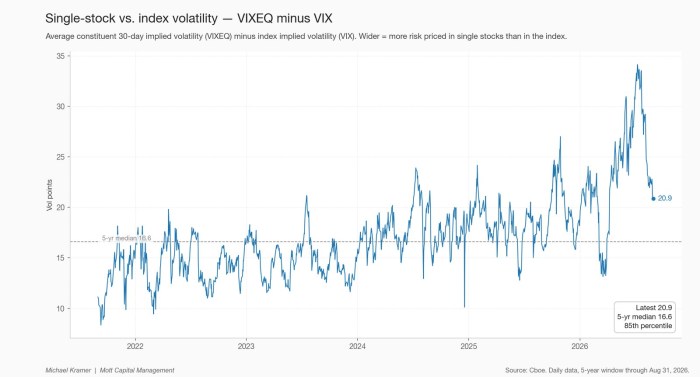
Single-stock vs. index volatility — VIXEQ minus VIX
Rates & the Fed
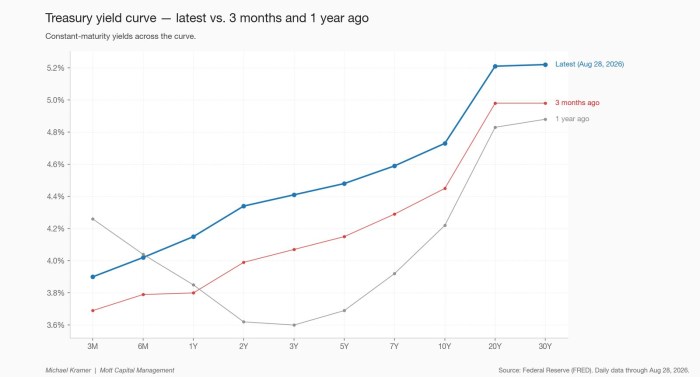
Treasury yield curve — latest vs. 3 months and 1 year ago
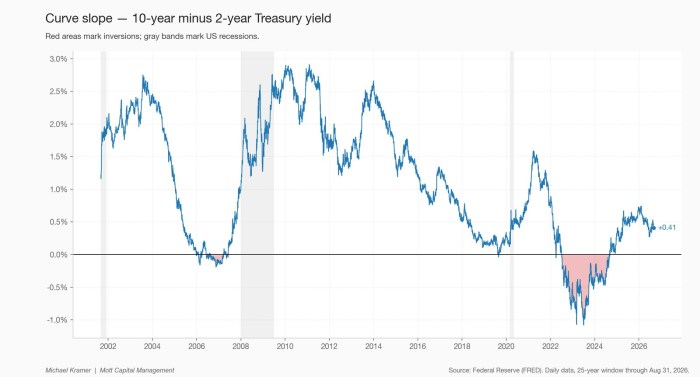
Curve slope — 10-year minus 2-year Treasury yield
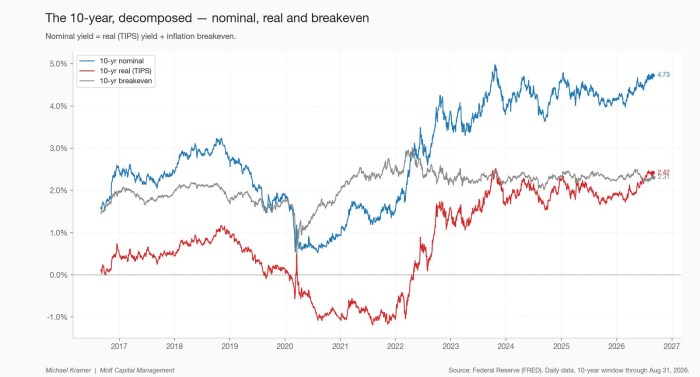
The 10-year, decomposed — nominal, real and breakeven
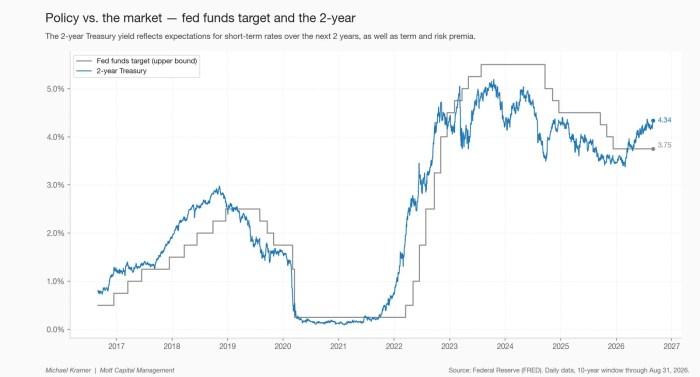
Policy vs. the market — fed funds target and the 2-year
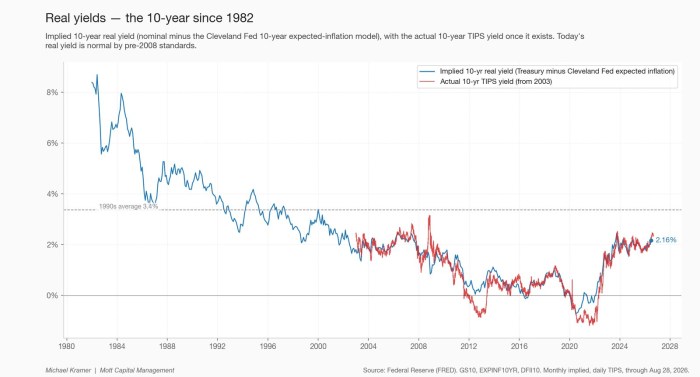
Real yields — the 10-year since 1982
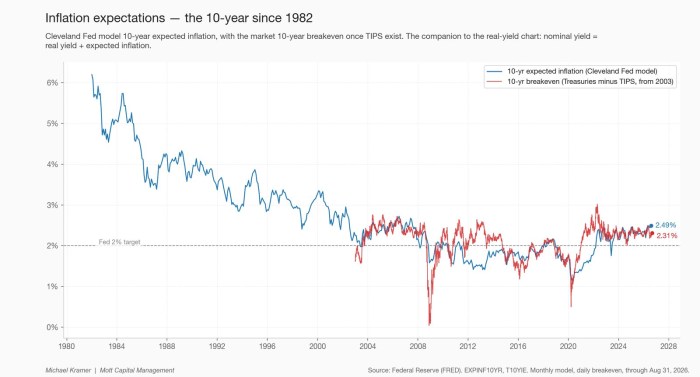
Inflation expectations — the 10-year since 1982
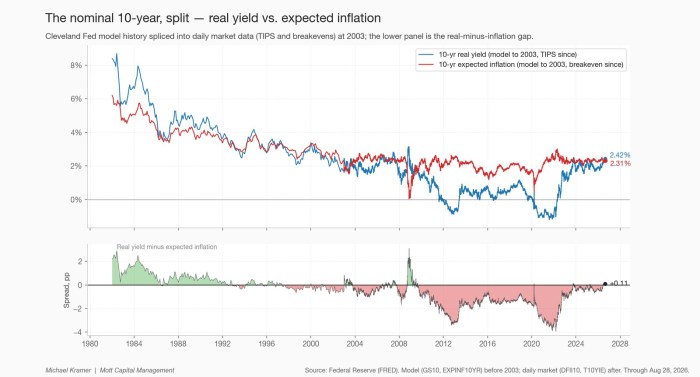
The nominal 10-year, split — real yield vs. expected inflation
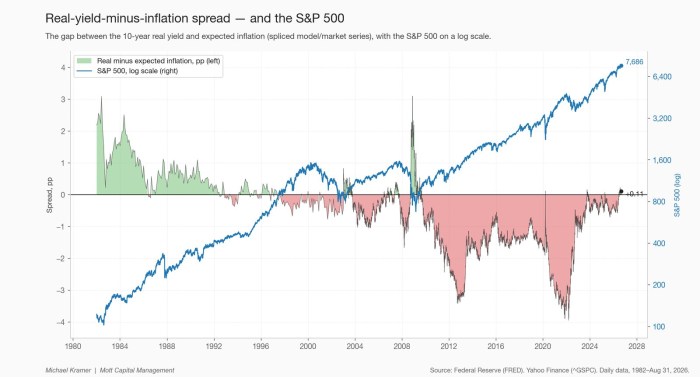
Real-yield-minus-inflation spread — and the S&P 500
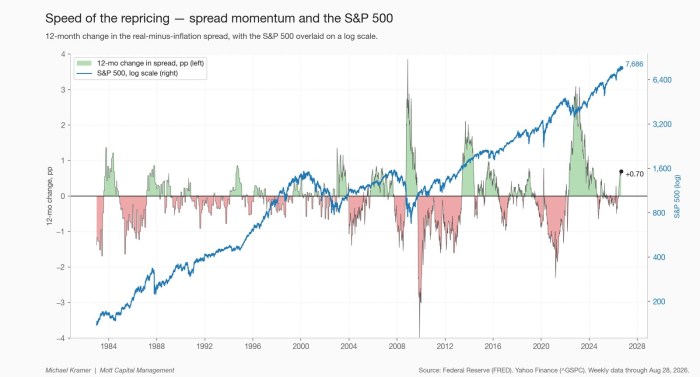
Speed of the repricing — spread momentum vs. drawdowns
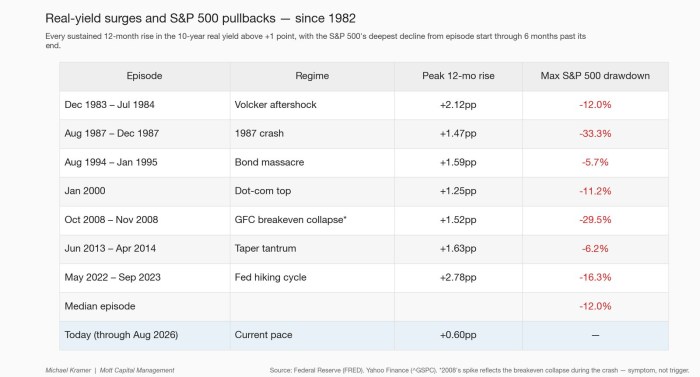
Real-yield surges and S&P 500 pullbacks — since 1982
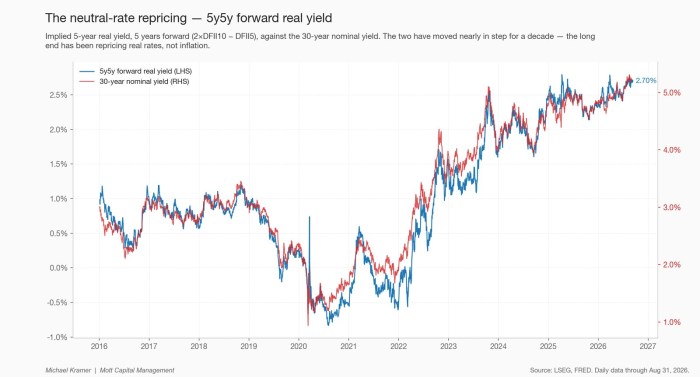
The neutral-rate repricing — 5y5y forward real yield vs. the 30-year
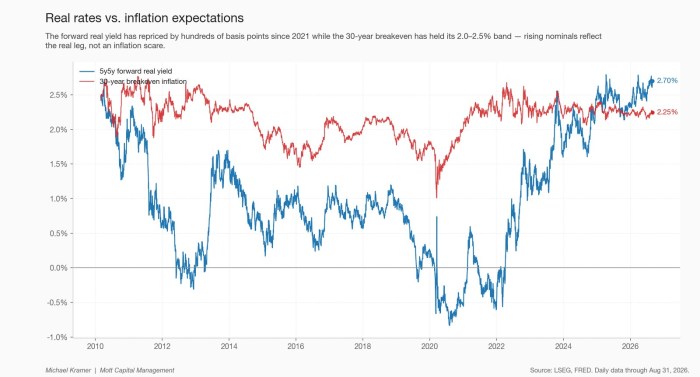
Real rates vs. inflation expectations — forward real yield and the 30-year breakeven
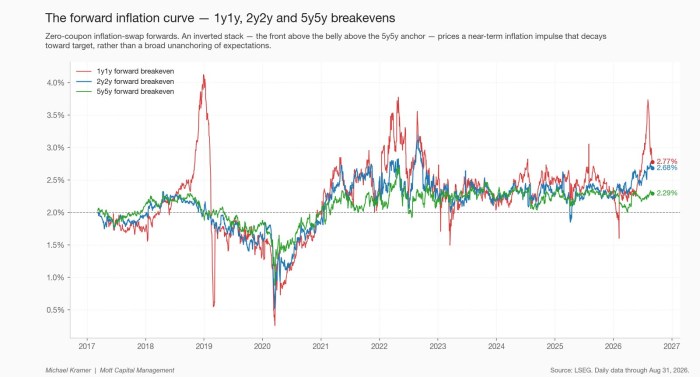
The forward inflation curve — 1y1y, 2y2y and 5y5y breakevens
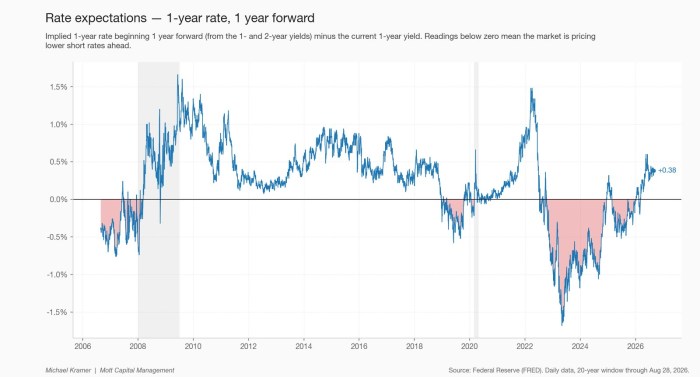
Rate expectations — 1-year rate, 1 year forward
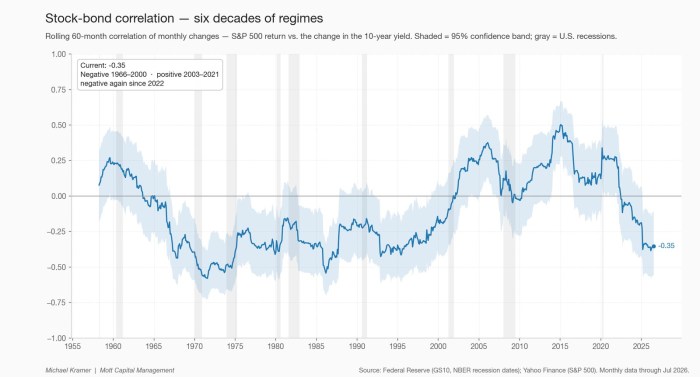
Stock-bond correlation — six decades of regimes
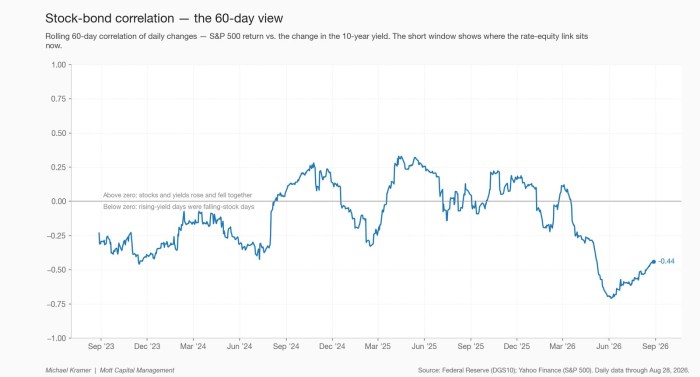
Stock-bond correlation — the 60-day view
Money & Velocity
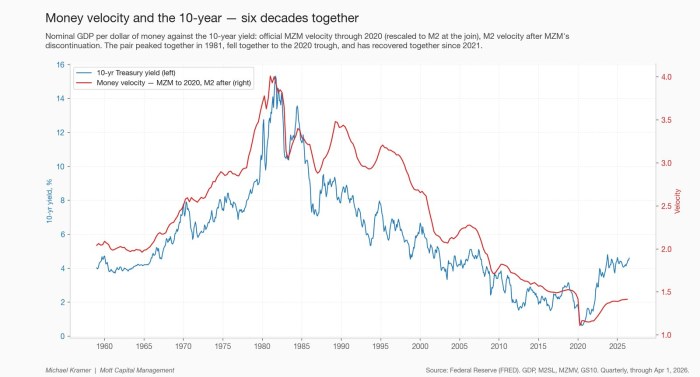
Money velocity and the 10-year — six decades together
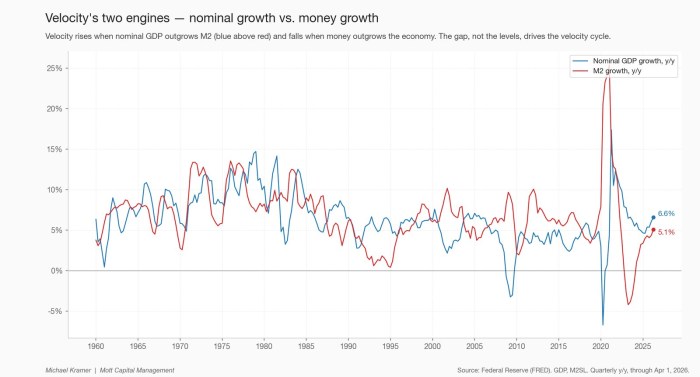
Velocity's two engines — nominal growth vs. money growth
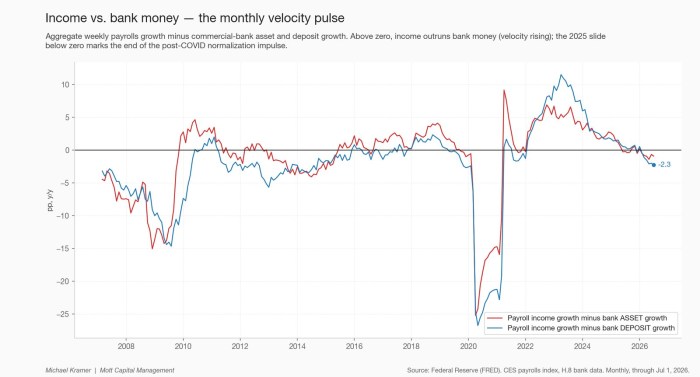
Income vs. bank money — the monthly velocity pulse
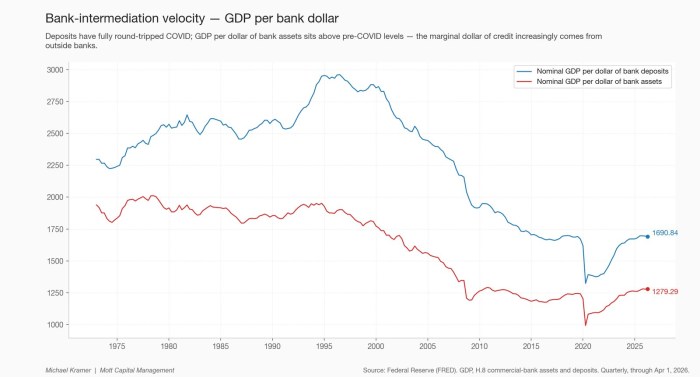
Bank-intermediation velocity — GDP per bank dollar
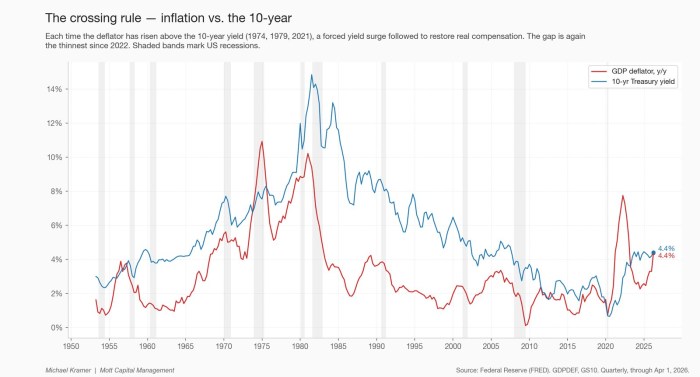
The crossing rule — inflation vs. the 10-year
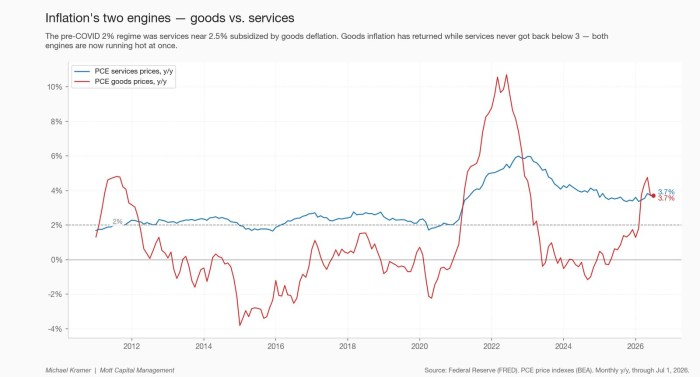
Inflation's two engines — goods vs. services
Liquidity & Credit
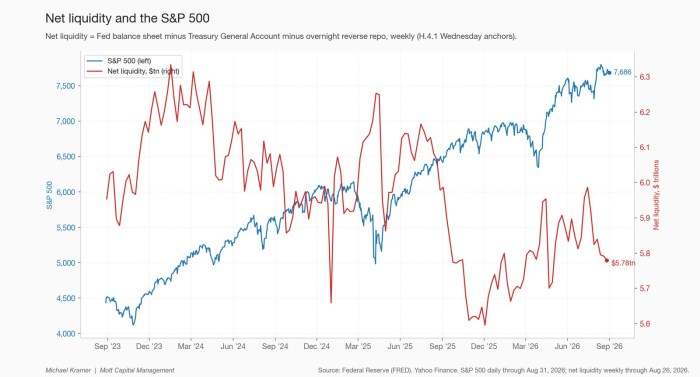
Net liquidity and the S&P 500
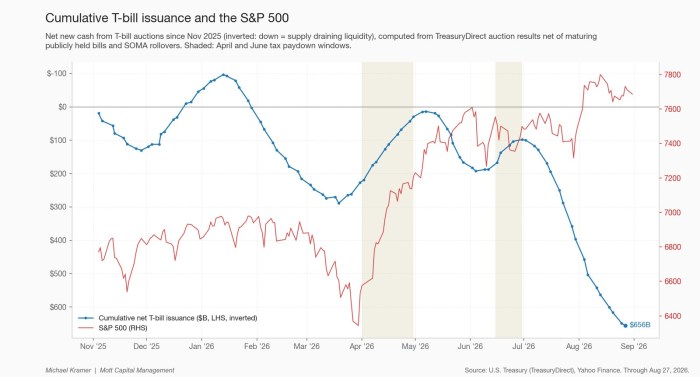
Cumulative T-bill issuance and the S&P 500
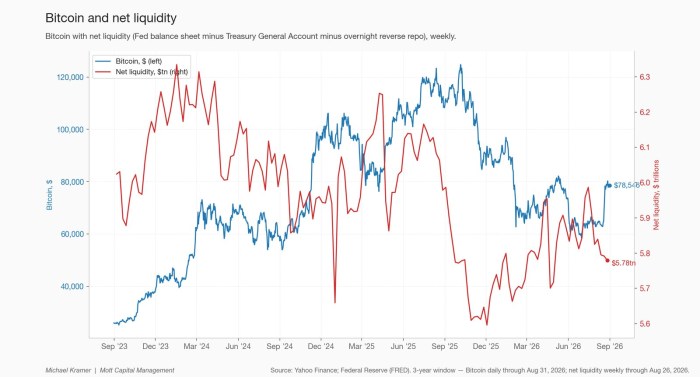
Bitcoin (BTC.X) and net liquidity
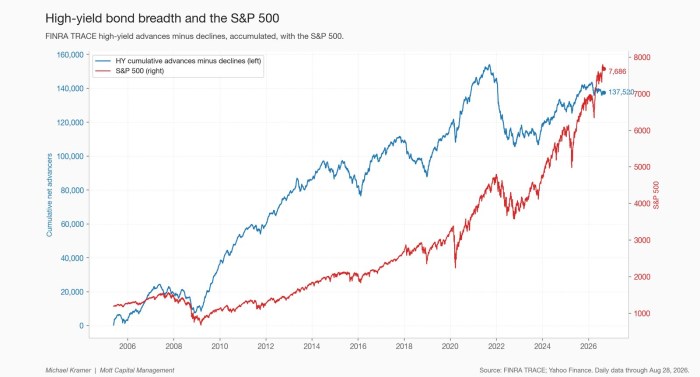
High-yield bond breadth and the S&P 500
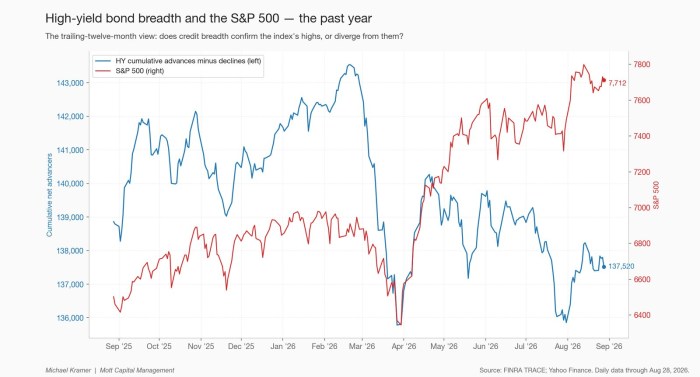
High-yield breadth — the 1-year view
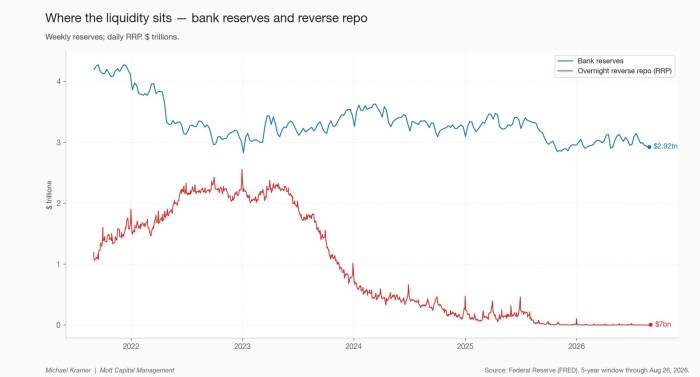
Where the liquidity sits — reserves and reverse repo
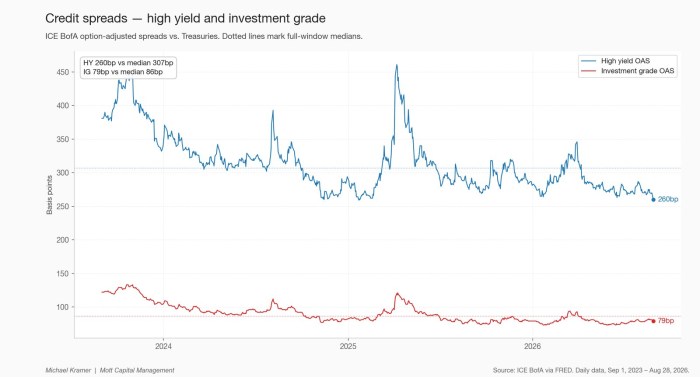
Credit spreads — high yield and investment grade
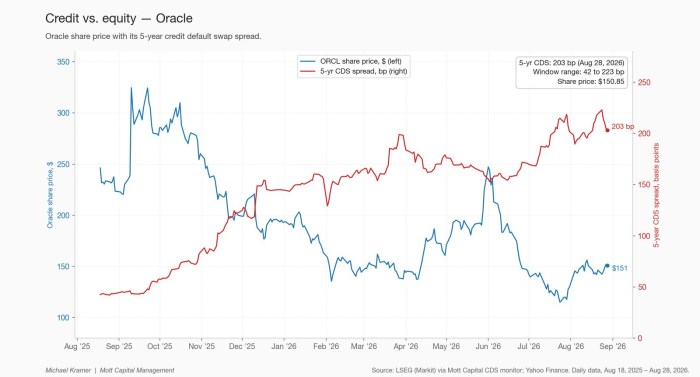
Credit vs. equity — Oracle (ORCL)
Earnings & Valuation
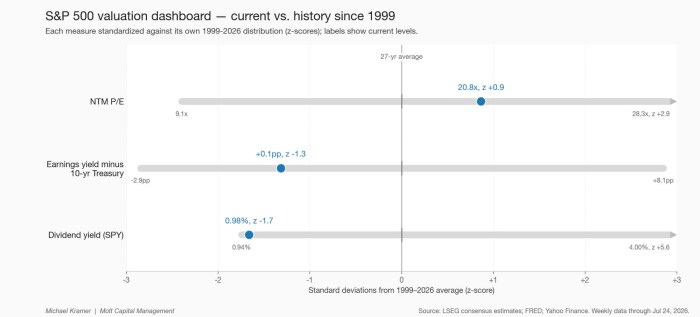
S&P 500 valuation dashboard — current vs. history since 1999
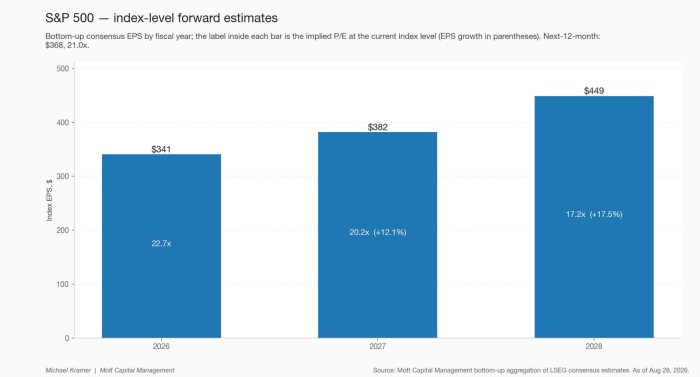
S&P 500 — index-level forward estimates
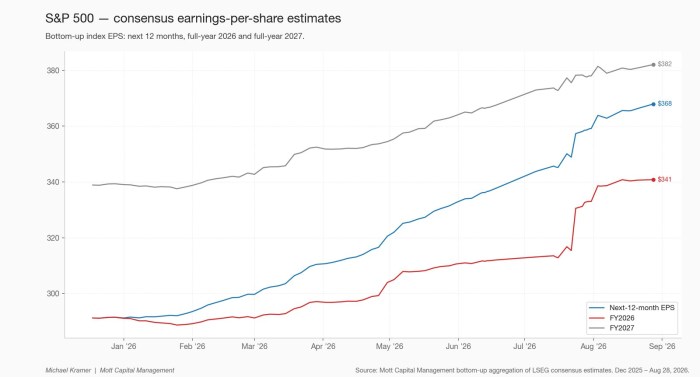
S&P 500 — consensus earnings-per-share estimates
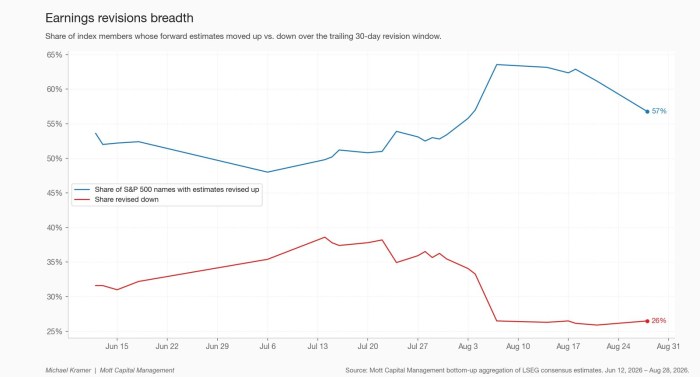
Earnings revisions breadth
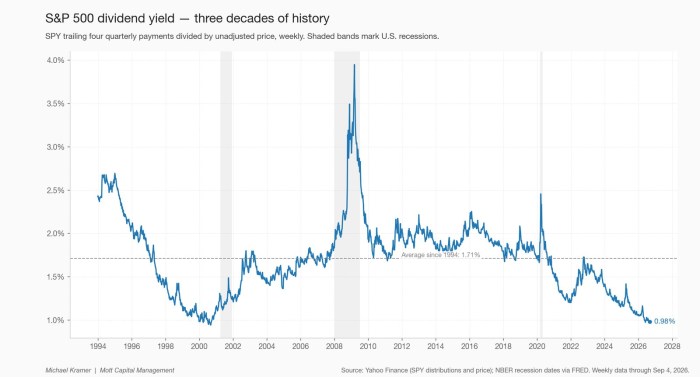
S&P 500 dividend yield — three decades of history
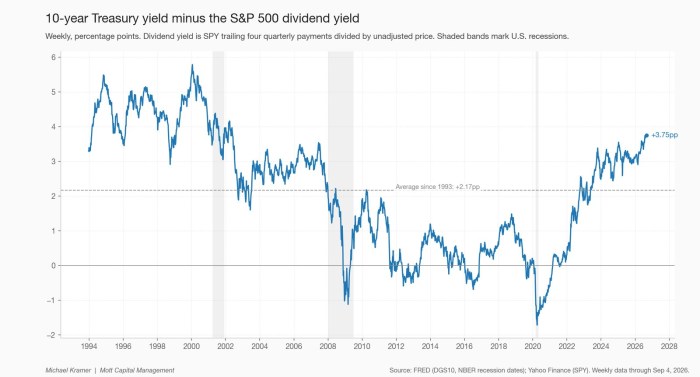
10-year Treasury yield minus the S&P 500 dividend yield
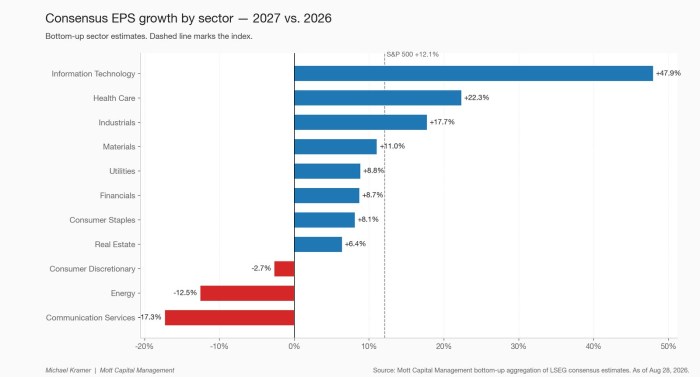
Consensus EPS growth by sector — 2027 vs. 2026
Macro & Cross-Asset
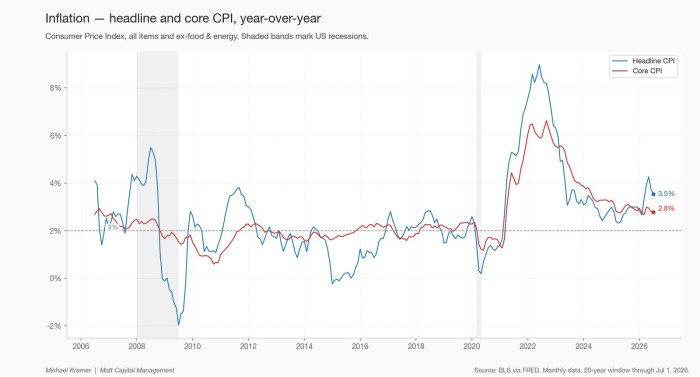
Inflation — headline and core CPI
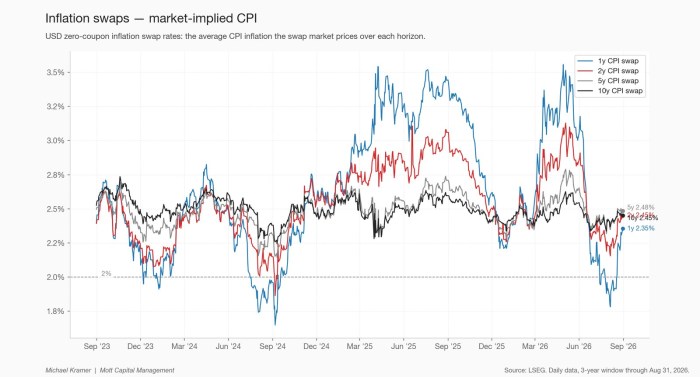
Inflation swaps — market-implied CPI
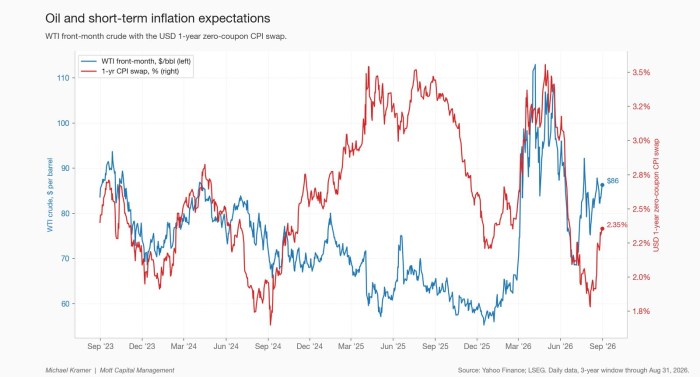
Oil and short-term inflation expectations
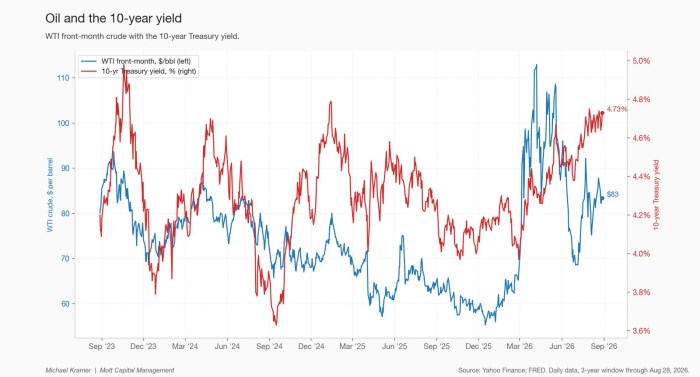
Oil and the 10-year yield
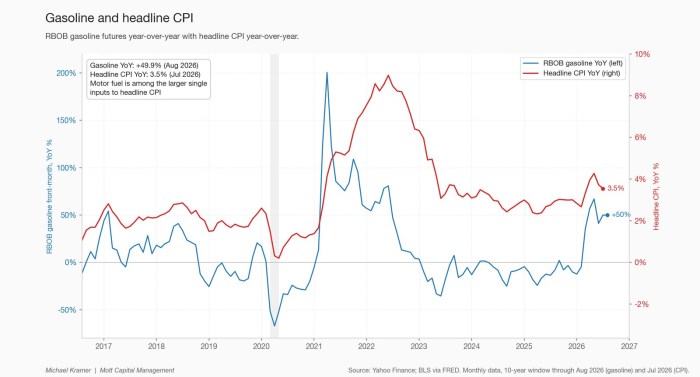
Gasoline and headline CPI
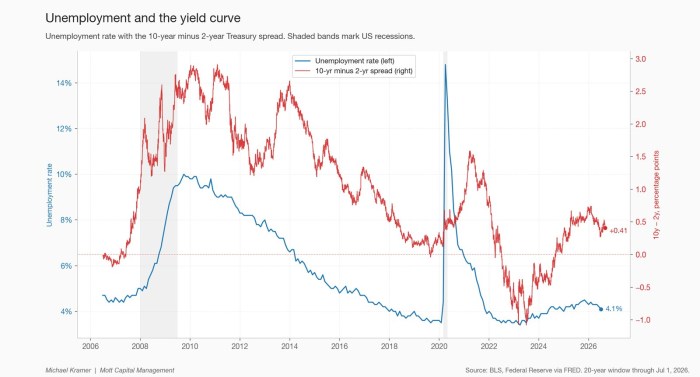
Unemployment and the yield curve
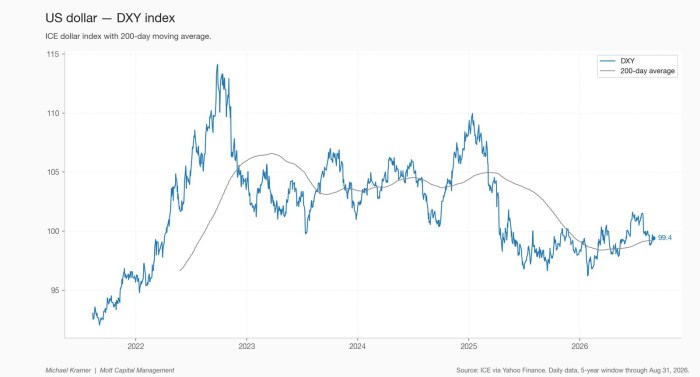
US dollar — DXY index
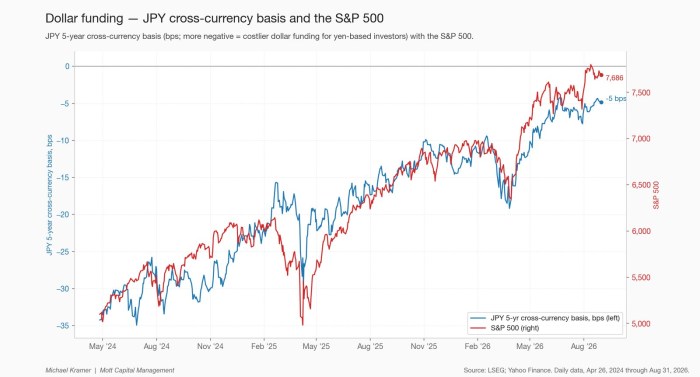
Dollar funding — JPY cross-currency basis and the S&P 500
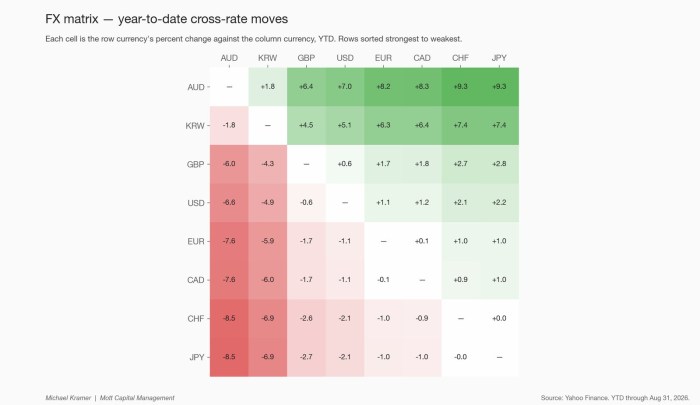
FX matrix — year-to-date cross-rate moves
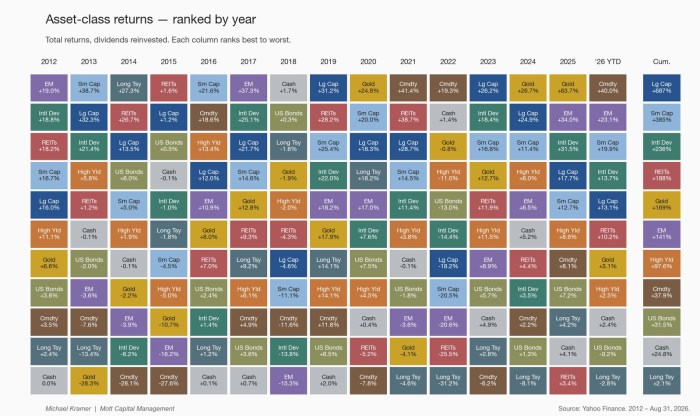
Asset-class returns — ranked by year
International
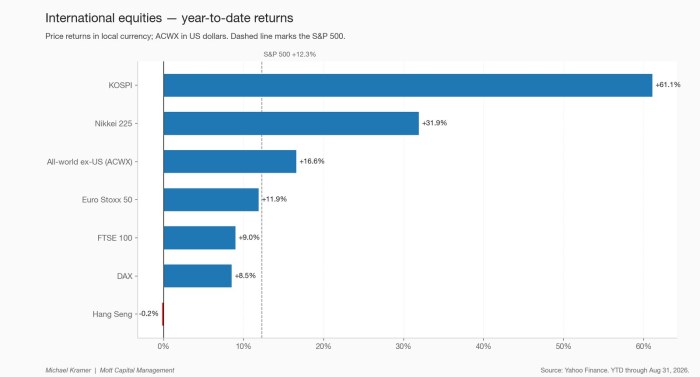
International equities — year-to-date returns
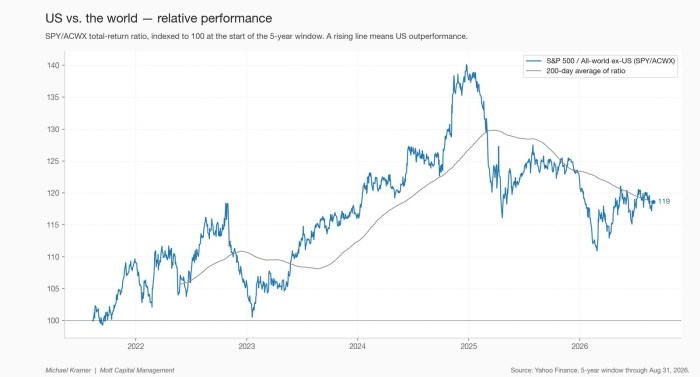
US vs. the world — relative performance


Comments
Log in or sign up to join the conversation.