


Photo by American Public Power Association on Unsplash
Natural gas looks to be turning bullish after a projected five-wave impulse from the lows, followed by an ABC correction. It gave us a nice bullish setup formation by Elliott Wave theory, so more upside is in view, especially if breaks back above 4.0 bullish confirmation level, just watch out for short-term intraday pullbacks.
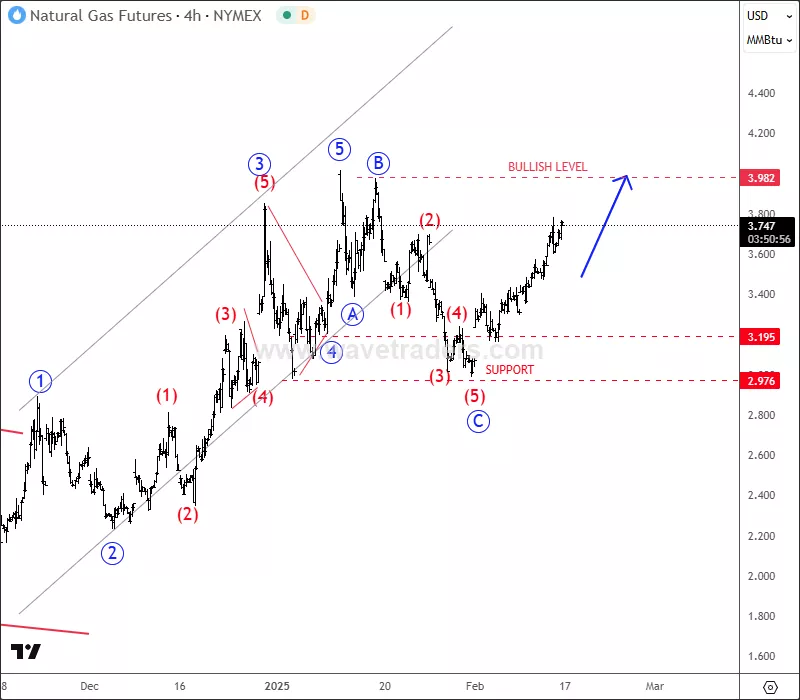
NG 4H Chart
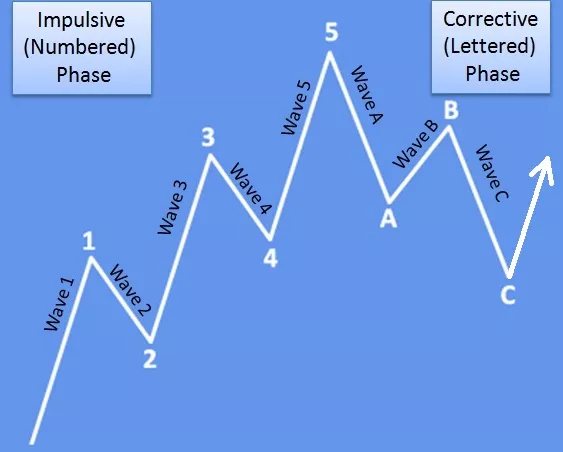
Basic bullish pattern shows that Natural gas may resume its uptrend by Elliott Wave theory.
More By This Author:
AUDJPY Is Recovering After The Wedge Pattern
Crude Oil Outlook: Bearish Pattern, Triangle Formation, And Key Levels To Watch
Stocks And Cryptos Have Space For More Gains



Comments
Log in or sign up to join the conversation.