

I am pleased to report a month-over-month home price decline. But don’t get too excited.
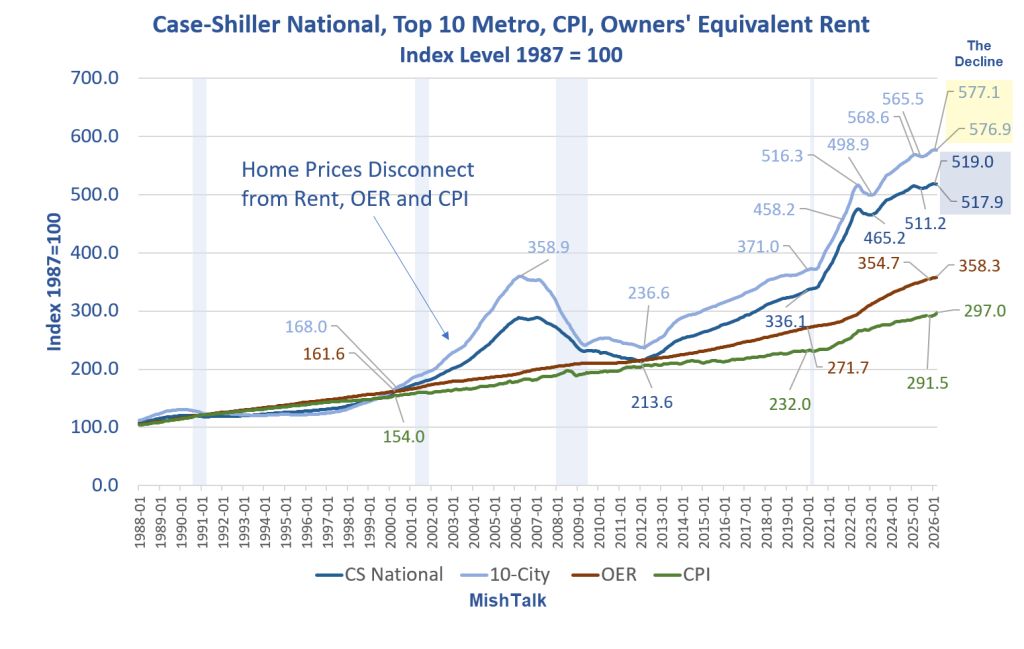
Case-Shiller Chart Notes
CS National: Case Shiller National Home Price Index
10-City: Case Shiller 10-City Home Price Index
CPI: Consumer Price Index
OER: Owners’ Equivalent Rent, the price one would pay to rent their own home unfurnished without utilities
All of the above are seasonally adjusted.
Case Shiller March Report
Please note Case-Shiller Index Reports Annual Gain in March 2026
The S&P Cotality Case-Shiller U.S. National Home Price NSA Index posted a 0.7% annual gain for March 2026, down from a 0.8% rise in the previous month.
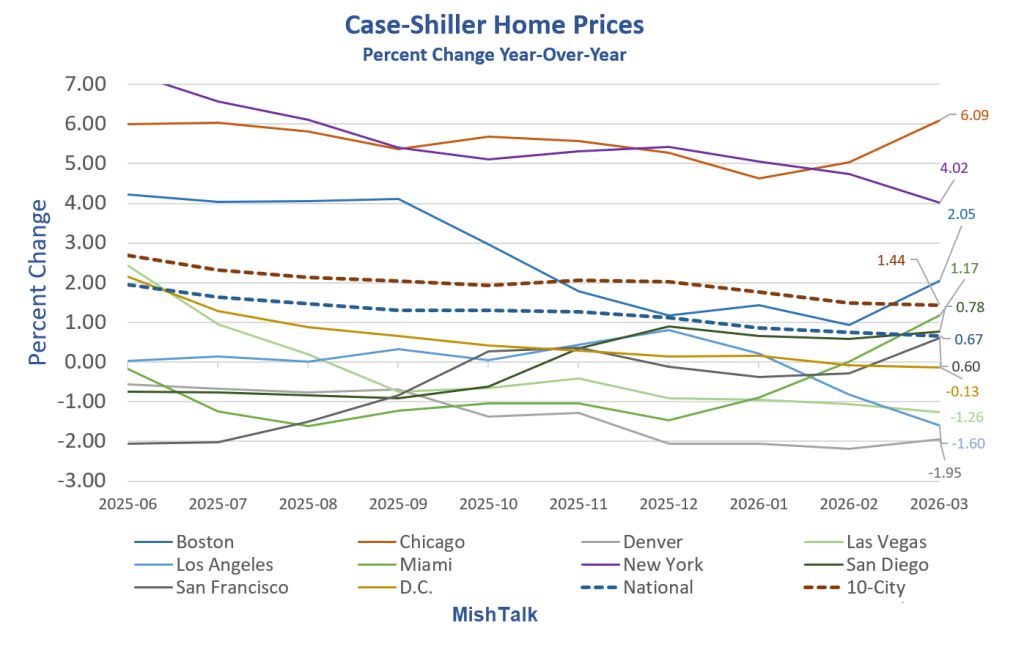
More than half of major U.S. metropolitan markets posted year-over-year price declines in March, with Seattle (-2.5%) displacing Denver as the weakest market and Chicago (6.1%) remaining the strongest.
For the 10th consecutive month, inflation outpaced national home price appreciation, with March CPI running 2.6 percentage points above the 0.7% annual gain, extending the streak of negative real home price returns.
“More than half of the 20 major U.S. housing markets recorded year-over-year price declines in March, reflecting a broadening and deepening housing slowdown,” said Nicholas Godec, CFA, CAIA, CIPM, Head of Fixed Income Tradables & Commodities at S&P Dow Jones Indices. “The S&P Cotality Case-Shiller National Home Price Index edged up just 0.7% in March from a year earlier, decelerating from February’s 0.8% rate. With consumer inflation accelerating to roughly 3.3% in March, U.S. home values have now fallen in real terms for the 10th consecutive month, underscoring an ongoing erosion of inflation-adjusted housing wealth.
“The geographic divergence remains stark,” Godec continued. “Midwest and Northeast markets are sustaining modest growth, while much of the Sun Belt and Western regions are still seeing declines. Chicago led all cities with a 6.1% annual gain, followed by New York (4.0%) and Cleveland (3.0%). In contrast, Seattle’s 2.5% year-over-year decline was the steepest in March, with Denver (-2.0%), Tampa (-1.9%), Dallas (-1.7%), and Phoenix (-1.6%) joining Seattle among the weakest performers. Even Los Angeles (-1.6%) and Washington (-0.1%) turned negative. The spread between the strongest and weakest markets – 8.6 percentage points, from Chicago’s +6.1% to Seattle’s -2.5% – highlights how localized this housing cycle has become.
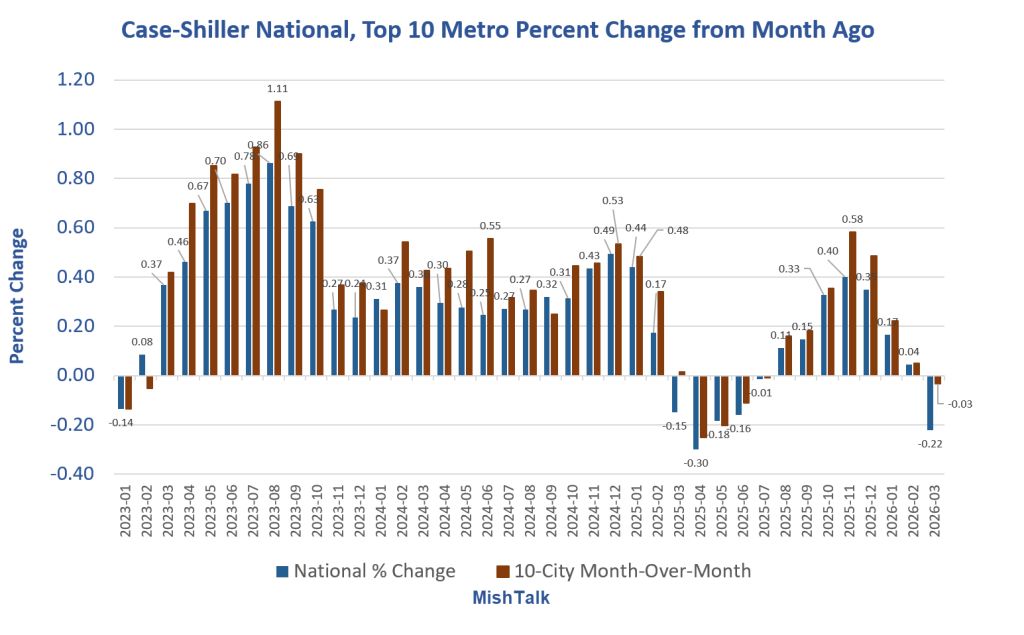
“Monthly price movements offered a seasonal spring lift but little underlying momentum. Before seasonal adjustment, the National Index climbed 0.7% from February, and even double-digit composite markets like the 10-City and 20-City posted strong March gains (1.2% and 1.0% NSA, respectively). Yet after seasonal adjustment, the National and 20-City indices both slipped 0.2%, and the 10-City ticked down 0.03%, confirming that demand remains soft as we head into spring. The latest six months saw only a negligible 0.3% rise in national home prices, barely keeping pace with the 0.3% in the prior half-year – a sign of a housing market nearly at a standstill.
Case-Shiller National, Top 10 Metro, Percent Change From Month Ago
Case-Shiller Home Prices Percent Change Year-Over-Year
Slowdown in Perspective
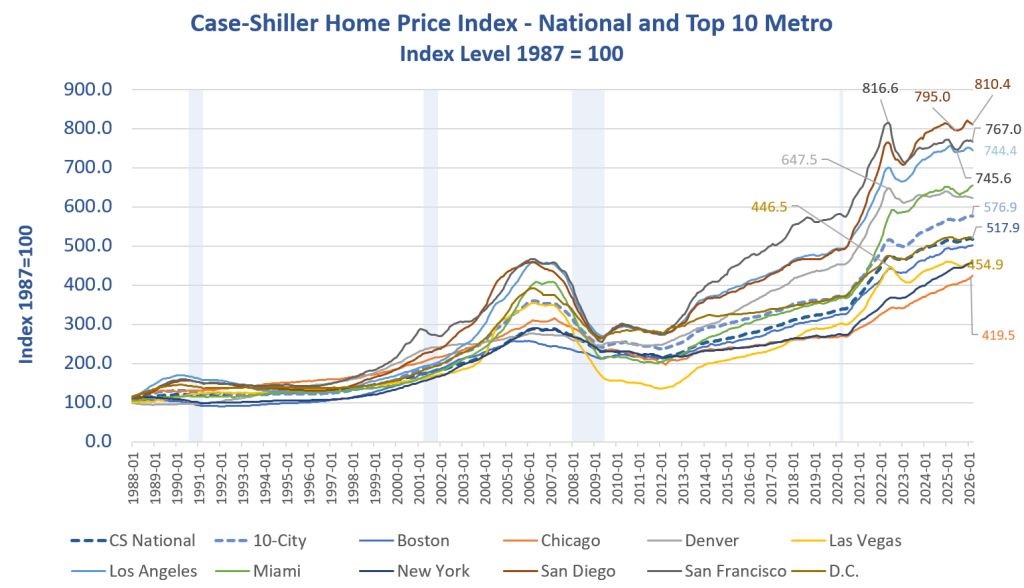
The above chart and the lead chart put the slowdown into proper perspective.
A 50 percent decline in home prices is needed before we can talk about affordability.
Between 1988 and 2000, home prices rose in sync with rent, OER, and the CPI. A huge series of Fed mistakes, first by Bernanke, then repeated by Powell led to home prices soaring wildly.
Interest Rates vs Case-Shiller National Home Price Index
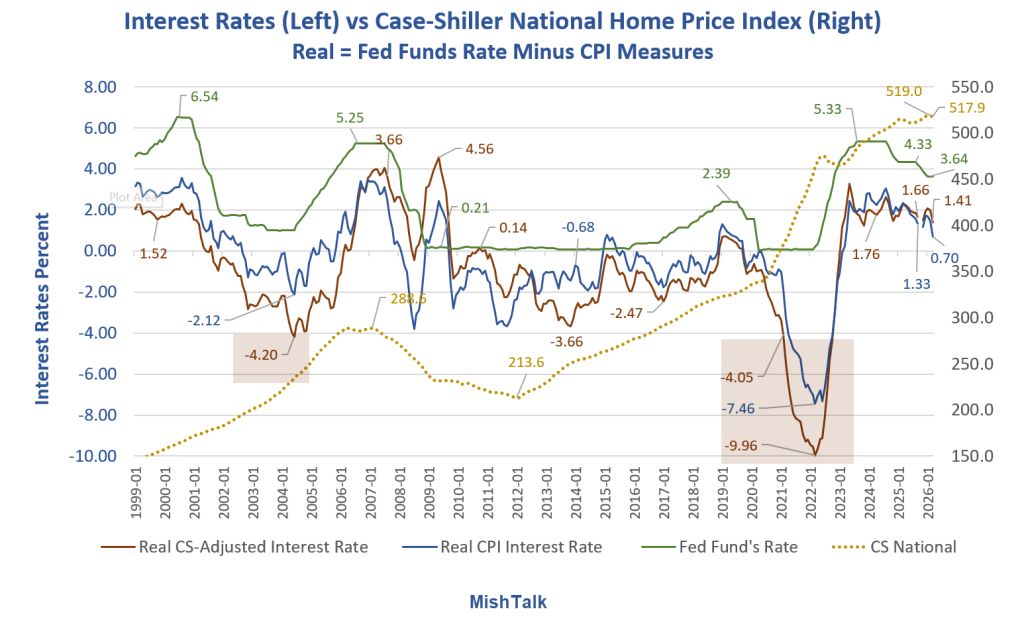
In response to the dotcom bubble recession and then again in 2020, the Fed slashed interest rates to ridiculously low levels.
I calculate real (inflation-adjusted) interest rates two ways, first against the CPI, and second substituting home prices for OER in the CPI.
In the dot-com bubble real interest rates were negative 4.2 percent. The Fed repeated this error, and then some in 2020 with real interest rates of -9.76 percent by my measure and -7.46 percent straight up.
Now, the housing market is fully broken with few willing to trade a 3 percent mortgage for a 6 percent mortgage.
The Fed has never admitted either error. And consumers are increasingly in trouble with the inflation that the Fed and Congress cooperated to create, the Fed by policy and Congress by spending.
Related Posts
May 12, 2026: CPI Hotter than Expected, Highest in Three Years, a Genuine Disaster
Inflation in April was another scorcher. Here are some month-over-month and year-over-year charts.
May 17, 2026: Ground Beef Soars to $6.90 per Pound. Trump Has No Winning Actions
Trump is boxed in on agriculture and the War in Iran.
May 26, 2026: Consumer Credit Stress Is Comparable to the Great Recession
Auto delinquencies are at a new record and credit cards are near record high.
Comments
Log in or sign up to join the conversation.