


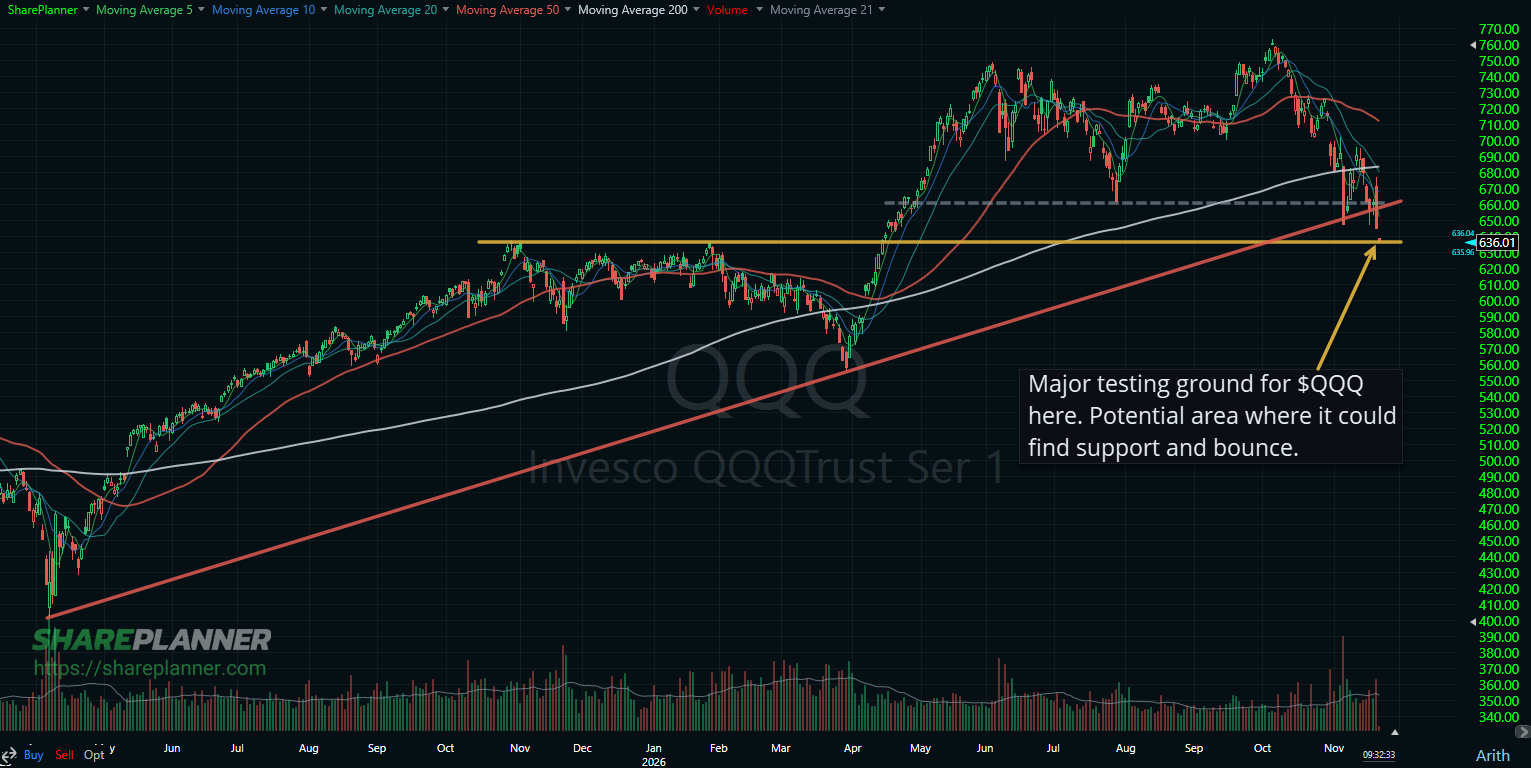
The Nasdaq 100 (QQQ) is sitting right on a major long-term support level. Holding the $636 to $637 area is crucial for any chance at a short-term bounce. And even if a bounce does come, there’s plenty of resistance stacked up above. The strongest of it is the short-term trend-line off the all-time highs.
How far has the Nasdaq 100 fallen?
QQQ topped out near $763 in early October. It’s now trading around $636, which puts it down roughly 17% from the highs. The Nasdaq 100 officially entered correction territory at the start of the month, and the selling hasn’t let up. Thursday’s 2% drop marked the sixth straight losing day for the S&P 500, and chip stocks fell around the world again overnight.
What stands out most to me is how the market handled Nvidia’s earnings. Nvidia more than doubled its revenue from a year ago and guided higher, and the stock still closed lower the next day. It isn’t uncommon for stocks to do that, but when a market sells off on great earnings, that tells you a lot about where sentiment is, especially when it entered earnings having already been hammered by investors and the stock market as a whole. And still, buyers aren’t in a hurry to step in yet.
Why is the $636 to $637 level so important for QQQ?
It’s the old ceiling. QQQ’s highs in November of last year and again in January both stalled right at this level, and the stock chopped around underneath it for months. It finally broke out in April and never looked back, until now.
That’s the classic setup where old resistance becomes new support, and this is the first time QQQ has come back to test it from above. It matters even more because QQQ already lost its rising trend-line off the April 2025 lows this week. If $636 to $637 gives way too, QQQ falls back inside that old trading range, and the bottom of that range is a long way down.
What resistance levels should you watch if QQQ bounces?
Even if this level holds, a bounce has a lot of work to do:
The $655 to $661 area. This is where the broken trend-line from the April 2025 lows meets the late-July low. Both were support not long ago. Now they’re overhead.
The 200-day moving average, around $683. QQQ sliced through it earlier this month.
The short-term trend-line off the all-time highs. This is the one I’d watch most closely. QQQ has put in a series of lower highs since the October peak, and the line connecting them has capped every rally attempt so far. Until QQQ gets back above it, any bounce is just that, a bounce inside a downtrend.
How I’m trading QQQ here
If QQQ holds this level into the close, I’ll look for a bounce, but I’ll treat it as a trade, not a new uptrend. That means a tight stop just below support, and taking profits as it runs into the $655 to $661 area. I’m not expecting a V-shaped recovery while QQQ is still below that short-term trend-line.
If $636 to $637 breaks (which it is currently doing as of this writing), I stay defensive. There’s no reason to catch a falling knife, and cash is a position too.
It’s also monthly options expiration today, which can add some extra whipsaw, so I’ll wait for the close before reading too much into the intraday moves.
As I always say, Plan your trade, manage your risk, and the profits will take care of themselves.


Comments
Log in or sign up to join the conversation.