


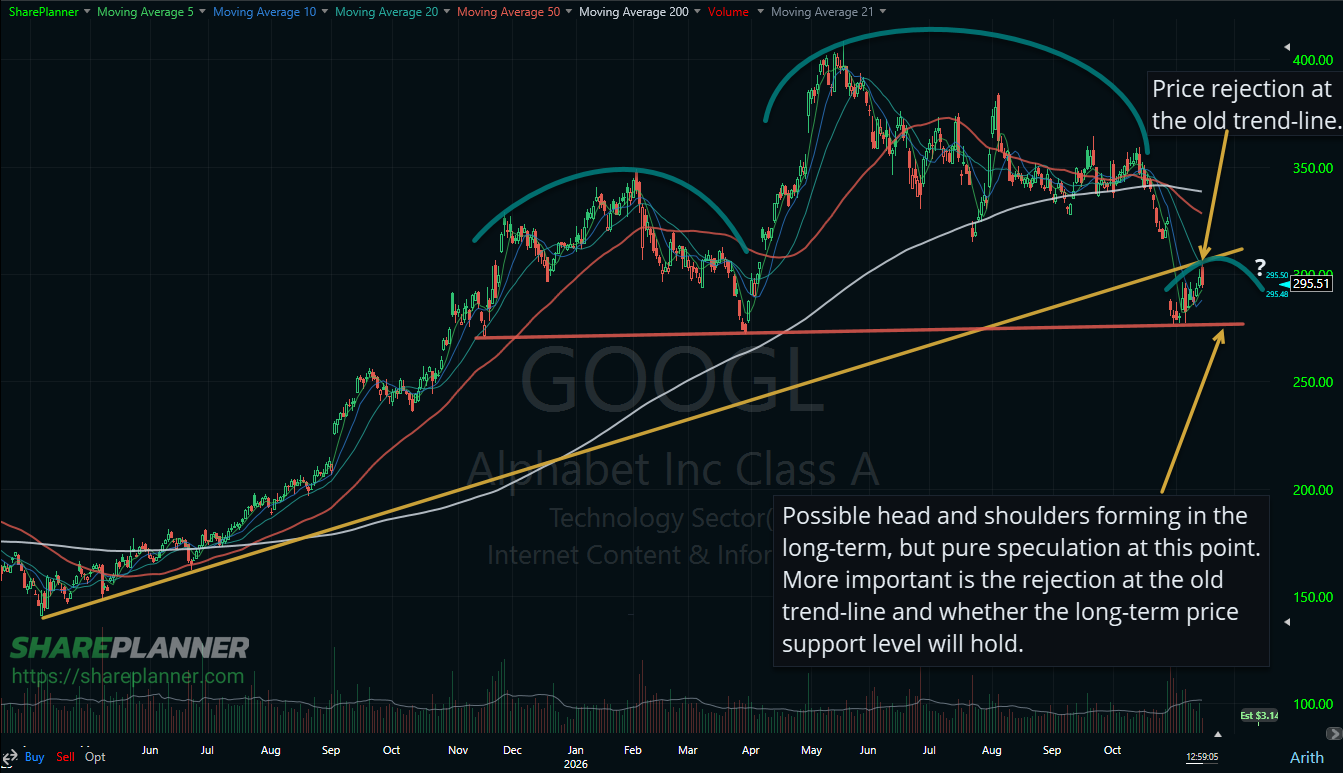
Alphabet (GOOGL) has been getting top heavy over the past year of trading, and after all of that, the stock is right back where it was a year ago. The bounce off this month’s lows just got rejected at the old trend-line, and from here, the level that matters most is $276 to $277. If that breaks, there isn’t much support underneath, and the head and shoulders pattern that has been trying to form on this chart becomes a lot more real.
Why did Alphabet stock fall?
It started with earnings. Alphabet grew revenue 25% in the third quarter, but earnings came in well short of expectations, and free cash flow turned negative as AI spending outran the cash the business brought in. The next day, the stock fell 12.6%, its worst single day drop ever. Then the post-election selloff in AI stocks piled on.
From the high near $408 to this month’s low, Alphabet lost roughly a third of its value. That’s a lot of damage for one of the biggest companies in the world.
What does the GOOGL chart show right now?
The rising trend-line off the spring 2025 lows carried Alphabet through its entire run. The earnings gap down broke it.
Since then, the stock bounced off the $276 area and started working on filling that gap. But the bounce ran straight into the underside of the old trend-line near $305 and got rejected. That’s what happens when support breaks. The line that used to hold the stock up becomes the ceiling it can’t get through, and the stock is now reversing the gap fill.
The moving averages aren’t helping either. Alphabet is trading well below its 50-day and 200-day moving averages, and the 50-day crossed below the 200-day in October.
Is Alphabet forming a head and shoulders pattern?
Possibly. The left shoulder topped in February near $347. The head topped in May near $408. And now the stock may be carving out a right shoulder.
But I want to be careful here. Right now, this is pure speculation. A head and shoulders isn’t a head and shoulders until price breaks the neckline, and on this chart, the neckline is that same $276 to $277 support level. I’ve seen plenty of these patterns try to form and never finish. So, I’m not getting ahead of the chart. Price has to prove it first.
Why does $276 support matter so much for GOOGL?
That level has held three times now: in November of last year, again this spring, and again earlier this month. Each time, buyers stepped in.
If it breaks, the support underneath gets sparse in a hurry. The last place price spent any real time was back around $250, from the fall of last year. That’s a long way down with very little to slow it, and a close below $276 would formalize the head and shoulders that’s being attempted on the chart.
How I’m handling Alphabet
I’m not interested in buying GOOGL while it’s stuck below the old trend-line and both major moving averages. For the bulls, the first job is holding $276. The second is getting back above that trend-line near $305. Until both happen, any bounce is just a bounce.
For the bears, a close below $276 is the trigger. That breaks the neckline, completes the pattern, and gives you a clean spot to define your risk above it.
Either way, I know where I’m wrong before I take the trade. Like I always say: Plan your trade, manage your risk, and the profits will take care of themselves.


Comments
Log in or sign up to join the conversation.