


Semiconductors Bounce Back Hard After Last Week’s Breakdown
The iShares Semiconductor ETF (SOXX) is up a staggering 7.6% today, and the bounce off last week’s complete breakdown keeps on going. Given everything that has been thrown at this market over the past week, that is remarkable.
What happened to semiconductor stocks last week?
Last week was ugly. The midterm elections handed Democrats control of both chambers of Congress, and the market decided that was bad news for the AI buildout. Fears of tighter rules on data centers hit the chip stocks first and hardest. On Thursday, SOXX dropped 12% in a single session, its worst day since March 2020.
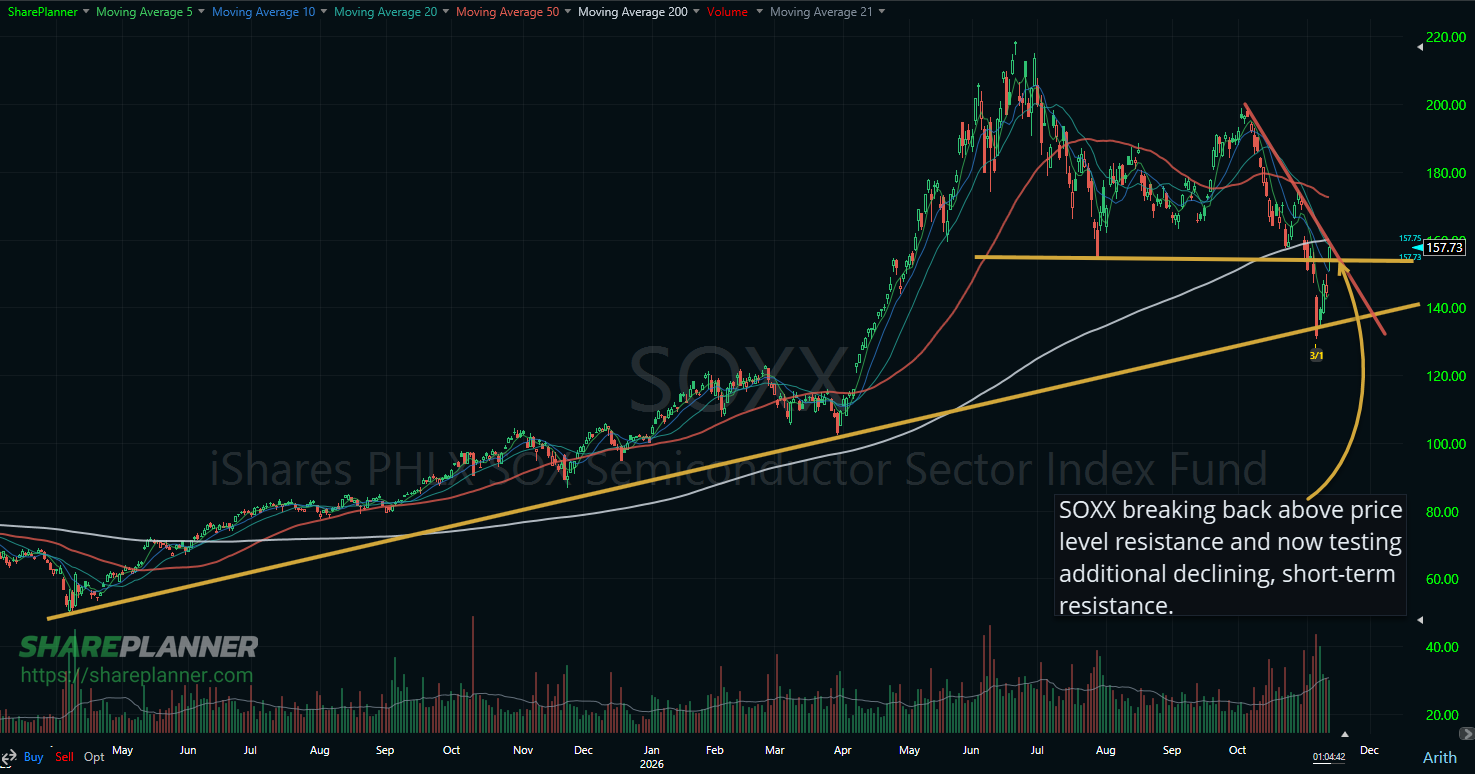
Here’s what that looked like on the chart. During the breakdown, price sliced through the rising trend-line that has held SOXX up since the spring of 2025. But it didn’t stay down there for long. The very next day, SOXX gapped back above that trend-line, and it has been off to the races ever since.
Why is SOXX rallying while Nvidia keeps falling?
Nvidia (NVDA) is down an additional 10% since Thursday. When the biggest name in the AI trade is still getting sold, you would expect the whole group to struggle. It hasn’t.
Nvidia makes up only about 7% of SOXX. AMD and Broadcom (AVGO) carry more weight, and they’ve been leading the rebound. Nvidia also has its own headline problem right now with Jensen Huang, which I wrote about here. So this isn’t one stock dragging an ETF higher. The buying is spread across the sector, and that’s a healthier sign than a one-stock rally.
Then there’s inflation. Tuesday’s CPI report came in hot, with prices up 0.4% in October against expectations of 0.3%, and core inflation running ahead of forecasts too. That all but locks in a rate hike from the Fed in December. Normally, that is poison for high-flying tech stocks. Instead, the chips ripped higher today.
An election result the market read as unfriendly to AI, Nvidia getting hammered, and hot inflation. The market shook it all off and bounced right back.
What does the SOXX chart say now?
Two things stand out.
First, SOXX has broken back above the price level around $153. That level held as support this past summer, and losing it last week was a big part of the breakdown. Getting back above it repairs a lot of that damage.
Second, SOXX is now running straight into resistance. The declining trend-line off the October highs and the 200-day moving average are both sitting right around $158 to $160. That’s where the bounce gets another real test.
How I’m handling the bounce in semiconductors
A clean break above that declining trend-line and the 200-day moving average would tell me last week’s breakdown was a shakeout, and it opens the door for a run at the 50-day moving average up near $172. A rejection here puts SOXX back into a chop between $153 and $160 at best, and a retest of the rising trend-line in the mid-$130s at worst.
What I won’t do is chase a 7.6% day straight into resistance. The risk/reward there is lousy. I’d rather see a pullback that holds $153, or a confirmed break above the trend-line, before I put money to work. Either way, I know exactly where I’m wrong before I get in. Plan your trade, manage your risk, and the profits will take care of themselves.
Frequently Asked Questions
Why is SOXX up today?
SOXX is up 7.6% on November 11, 2026, extending its rebound from last week’s election-driven selloff. Semiconductor stocks are rallying across the board, even with Nvidia lagging and a hotter-than-expected inflation report on Tuesday.
Why did semiconductor stocks drop after the 2026 midterm elections?
Investors worried that a Democratic-controlled Congress would bring tighter regulation of AI and data centers, which could slow chip orders. SOXX fell about 12% on Thursday, November 5, its worst day since March 2020.
What are the key support and resistance levels for SOXX?
Resistance sits at the declining trend-line from the October high and the 200-day moving average, both near $158 to $160. Support is the $153 price level SOXX just reclaimed, with the longer-term rising trend-line in the mid-$130s below that.


Comments
Log in or sign up to join the conversation.