

Economic growth is increasingly weighed down by negative net exports, while weakening domestic demand remains the main driver, with tighter financial conditions. Inflation has yet to resume disinflation and is likely to be close to 30% this year with risks on the upside, requiring a prolonged period of tight monetary policy.
Turkey's economy at a glance
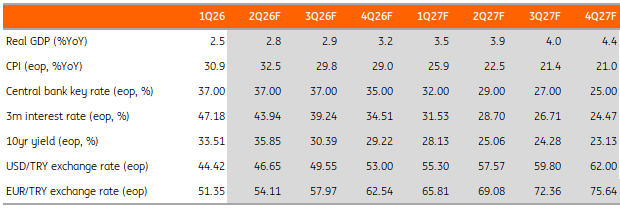
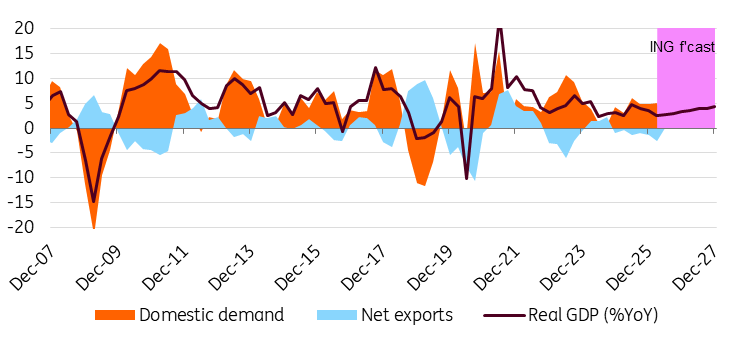
The contribution of net exports to GDP growth in the first quarter has shifted further into negative territory, exerting a more pronounced drag on growth. In contrast, domestic demand – despite a clear loss of momentum – has continued to serve as the primary driver of economic activity. Elevated borrowing costs, the expectation that interest rates will remain higher for longer, and the most recent central bank step toward a stricter macroprudential framework by further reducing loan growth caps may translate into a more marked slowdown in the second half of the year, possibly leading to GDP growth around 3%.
May inflation has not yet signalled a return to the disinflation trend, confirming that the path ahead remains challenging. Uncertainty surrounding oil prices – along with their spillover effects on other commodity prices – continues to pose risks to the outlook. Food inflation also contributes to this uncertainty, as it remains exposed to risks in both directions, shaped by the anticipated increase in agricultural production and potential pressures stemming from fertiliser costs. We expect annual inflation slightly below 30% this year.
The current account deficit in March maintained a widening trend with another large deficit, while weakening capital flows led to financing of the deficit mainly via reserves. Preliminary customs data from the Ministry of Trade suggest an improvement in the April current account despite war conditions in the nearby region, as the foreign trade deficit appears to have narrowed by close to 30% in comparison to last year thanks to export strength. In the months ahead, the trajectory of the current account balance is expected to be influenced by a mix of external risks alongside domestic demand conditions.
The conflict in the Middle East has required a prolonged period of tight monetary policy. This has been accompanied by further tightening in credit growth caps, driven by the continued widening trend in the current account deficit and rising financial stability concerns following the court decision. Accordingly, even though there has been no significant change or acceleration in lending trends recently, the CBT has implemented additional reductions in TRY-denominated growth limits for retail and corporate loans. These measures are more pronounced for consumer overdraft accounts, where limits have been lowered from 2% to 1%, and more moderate for SME loans, reduced from 5% to 4.5%.
This macroprudential tightening is likely to reduce the probability of any further policy action at the June MPC meeting. Nevertheless, ongoing geopolitical uncertainties and domestic political developments may call for a more cautious approach, which could lead to an upward adjustment in the policy rate – from 37% to the current effective funding rate of around 40%. Looking beyond June, we anticipate that the scope for easing will be quite limited in the second half of the year; we expect the policy rate to be at around 35% by year-end, with risks tilted toward a tighter policy stance.
Quarterly forecasts
FX and rates outlook
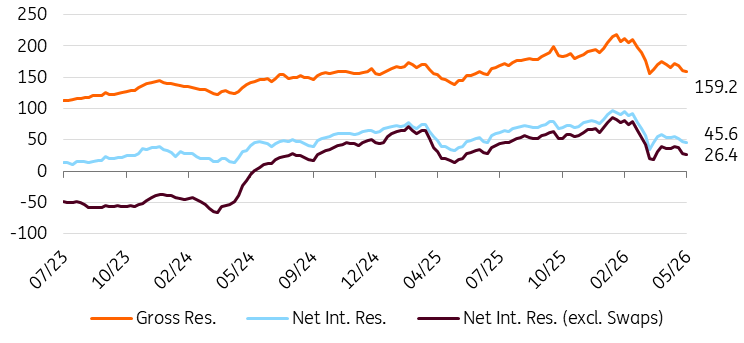
The market quickly shook off the May pressure on the Turkish lira. CBT kept the USD/TRY spot unchanged and FX implieds returned to almost previous levels. FX reserves fell by around US$8bn in the same period, suggesting a smaller cost compared to the start of the US-Iran conflict or March last year. With the difficult disinflation story of the last few months and the CBT’s visible efforts to keep FX stable, it is clear that the current FX regime is here to stay. FX reserves remain high, and despite the thinning FX carry, TRY remains a popular trade in the EM space, which we believe will not change in the coming months. At the same time, the widening current account deficit clouds the longer horizon and poses a problem for CBT in the future. We expect USD/TRY to be at 53.00 by the end of the year.
Global geopolitical easing and lower oil prices, coupled with a neutral inflation print for May, have brought some relief to the rates market with the 1y OIS rate falling back from around 41.00% during the May FX sell-off to below 39.50%. The market is currently only expecting the effective rate to normalise back to the key rate this year and the standard cutting cycle to resume next year, a quarter later than our forecast. This looks set to keep the market on the hawkish side for longer, depending on global energy prices and the US-Iran conflict, leaving market players on the sidelines for the fixed income story for now.
CBT reserves (US$ bn)
Sovereign credit views
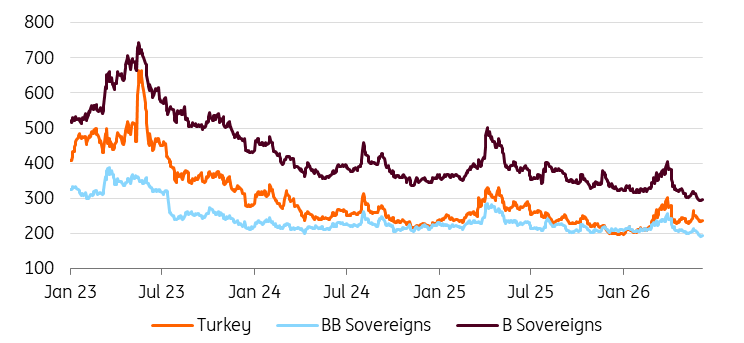
The first half of this year has seen plenty of volatility for Turkey’s dollar bonds, with both the energy shock from the Middle East and domestic political noise pushing spreads wider. Valuations have now cheapened relative to both the BB and B tier of sovereign peers, offering around a 45bp average pickup over BB levels.
While exposure to energy prices remains high, Turkey entered this year on an upward trend in terms of fundamentals, with the current account deficit under control and fiscal metrics heading in the right direction. In this context, shorter-dated bonds on the USD curve should remain well supported by investors, especially with good progress made so far in meeting the nation’s Eurobond issuance plans ($5.5bn in USD and €2bn in EUR raised YTD).
US$ Bond Sub-Index Spreads vs USTs
Inflation beats consensus again in May
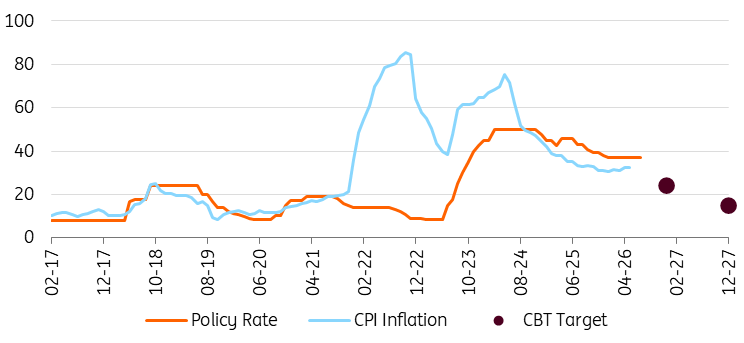
Monthly inflation in May turned out at 1.7% vs the market consensus of 1.5%, while annual inflation inched up to 32.6% (vs the CBT’s target at 24% and forecast at 26% in the latest inflation report) from 32.4% a month ago. While this shows that the disinflation trend has not resumed yet, processed food, clothing and transportation services were the key drivers for the negative surprise on the headline.
Core inflation (CPI-C) rose by 2.9% MoM and maintained strength, leading to an increase in the annual rate to 30.4% while the managed currency by the central bank, with modest nominal TRY depreciation in recent months, limited the increase. In other words, although the average increase in the USD/TRY accelerated to 1.6% in May compared to the previous month, its annual increase remaining at around 21-22% – significantly below inflation in the same period – indicates that the CBT maintains its exchange rate policy which supports the disinflation objective through the cost channel.
Inflation expectations and CBT forecast (12m- ahead, YoY%)
Momentum loss in 1Q GDP growth
In the first quarter of 2026, GDP growth was 2.5% year-on-year, falling behind the market consensus. The data show a significant moderation in comparison to previous quarters that were above 3% in the second half of 2025. From a sectoral perspective, services provided the strongest support for growth, followed by construction and communication. Industry, by contrast, was the only sector that pulled GDP down. Another issue worth mentioning is agriculture, which continuously contracted in 2025, turned positive and made a slight contribution in the first quarter.
1Q26 GDP translates into a quarter-on-quarter growth rate of a mere 0.1% after seasonal adjustments, the lowest since a sequential contraction in 2Q24. The slowdown was driven primarily by net exports, which contributed -0.7ppt to growth, followed by capital formation pulling the headline -0.6ppt, while private consumption was also weak with a mere 0.1ppt contribution, down from 2.8ppt a quarter ago. Inventory build-up (0.9ppt) and government consumption limited the extent of weakening in the sequential performance.
Real GDP (%YoY) and contributions (ppt)
Recovery in May PMI
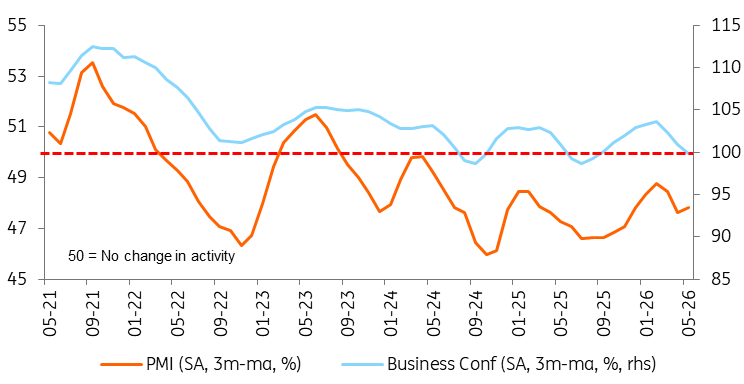
The manufacturing sector (seasonally adjusted basis) PMI, which changed direction and dropped in March and April following the geopolitical shock in the Middle East, recovered in May, moving up to near stabilisation levels at 49.8. The improvement is attributable to the increase in new export orders, ending a 20-month sequence of moderation and the expansion in purchasing activity, likely implying procurement of inputs in an environment of rising prices and supply-chain disruption caused by the US-Iran war. On the flip side, inflationary pressures have remained elevated attributable to geopolitics.
Whether the May PMI improvement can be sustained remains highly uncertain. Sectoral breakdowns reinforce the negative impact of the war on activity: aside from apparel, all sectors remained below the 50 threshold, and only five out of 10 recorded any improvement compared to April.
PMI & Business Confidence
Slight increase in April unemployment rate
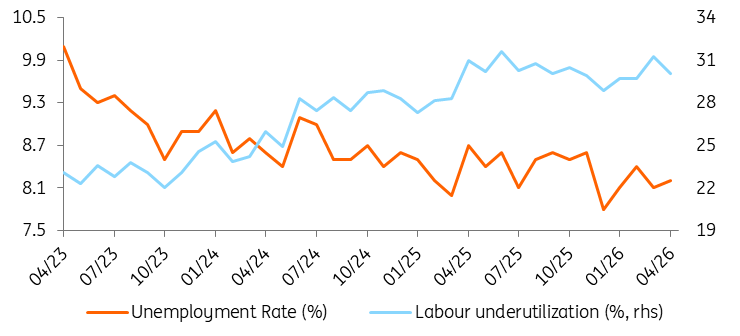
The seasonally adjusted headline unemployment rate, which has fluctuated within the 8.0-8.5% range since the start of the year, edged up slightly to 8.2% in April from 8.1% in the previous month. A closer look at the breakdown points to a decline in employment and a nearly equivalent number of individuals exiting the labour force, while the number of unemployed remained broadly stable. In April, the labour force contracted by 361K, with the participation rate declining to 52.4%, the lowest since early 2022.
Broader measures of labour market slack also signal slight changes compared to the previous month. The underutilisation rate – which combines time-related underemployment, the potential labour force, and the unemployed – dropped by 1.2ppt month-on-month to 30.1%. Despite intermittent fluctuations in the recent period, this indicator has exhibited an overall upward trend since the second half of 2022, remaining close to its historical peak of 31.3% recorded in March this year.
Labour market outlook
Initial signs of the war impact on budget
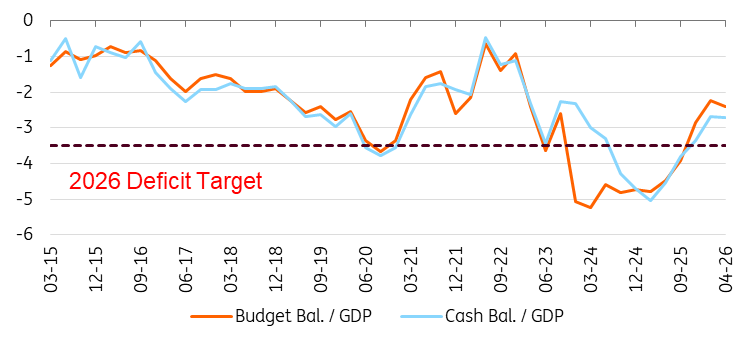
Budget data for the first four months of the year indicate some room to contain inflation risks, with the 12‑month rolling budget deficit standing at 2.4% of GDP. Looking at April alone, tax revenues rose by 28.5% year-on-year, reflecting a slowdown in both direct and indirect tax collection; while VAT revenues increased at a similar pace, excise tax receipts declined due to losses in fuel-related taxes following the reinstatement of sliding-scale tariffs, helping to contain first-round inflationary effects. At the same time, non-interest expenditures accelerated, driven by stronger capital spending and transfers.
Looking ahead, adjustments through sliding-scale tariffs are expected to widen the budget deficit, while a moderation in domestic demand under tighter financial conditions may pose additional upside risks. Separately, a newly enacted law facilitating the repatriation of offshore foreign exchange and financial assets – offering preferential tax treatment and protection from tax scrutiny – could attract inflows, potentially easing some pressure on reserves and partly mitigating policy trade-offs.
Budget performance
Source: Ministry of Treasury and Finance, ING
Another large current account deficit in March
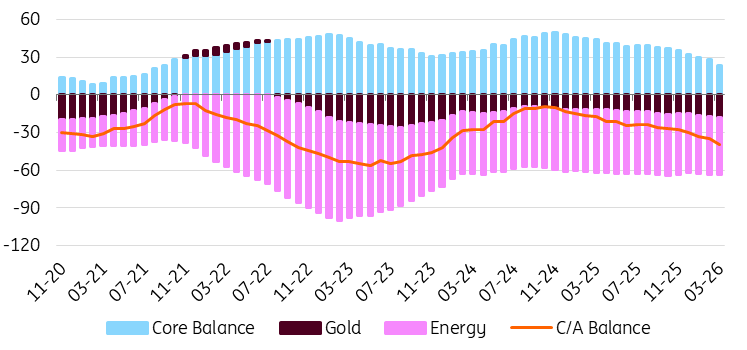
In March, the current account posted another large deficit at US$9.7bn, in line with the market consensus and our call. Following the data, the 12-month rolling current account deficit maintained the uptrend and reached US$39.7bn, or approximately 2.6% of GDP, from US$35.0bn a month ago. A closer look at the monthly figures shows that the deficit widened by roughly US$4.8bn compared to the same month of 2025, primarily due to a higher trade gap, which deteriorated from US$-4.9bn to US$-9.5bn. This stemmed from the turn of the core trade surplus in 2025 to a deficit and rising gold imports.
However, despite the US-Iran war that pushed energy prices significantly higher, the energy trade balance showed a slight improvement over the same month of last year. In the first quarter, on the other hand, not only a widening in the trade deficit driven by the same items for March but also a slight decline in services revenues, higher deficits in primary and secondary income were the factors that caused close to US$10bn deterioration in the current account.
On the capital account side, the war in the Middle East weighed markedly, with US$26.8bn outflows (the largest ever). With additional outflows from net errors and omissions of US$7.0bn, and considering the current account deficit, official reserves dropped by a record US$43.4bn.
Current account (12M rolling, US$bn)



Comments
Log in or sign up to join the conversation.