

SPX Monitoring purposes; Long SPX on 4/8/26 at 6782.81.
Our gain 1/1/24 to 12/31/24 = 29.28%; SPX gain 23.67%
Our Gain 1/1/23 to 12/31/23 SPX= 28.12%; SPX gain 23.38%
Monitoring purposes GOLD: Long GDX at 75.76; 9/29/25
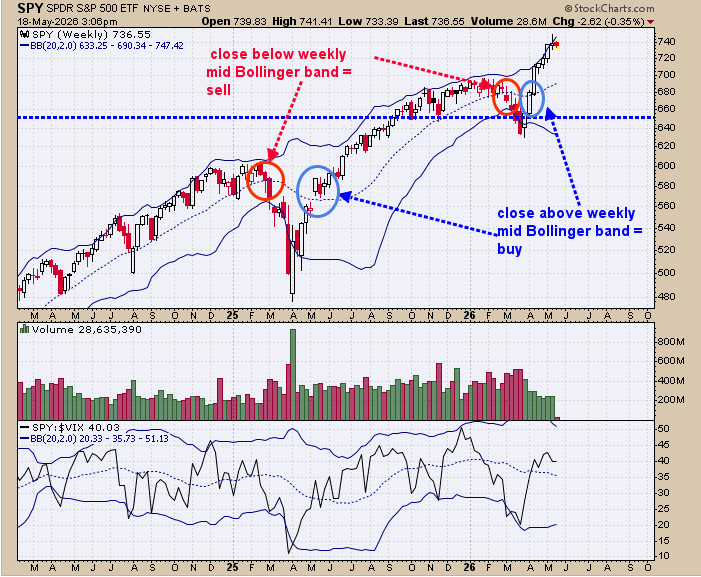
Momentum rules all indicators. Above is the weekly SPY with its Bollinger band. The weekly trend is up when the SPY is above its weekly mid Bollinger band (circled in blue on the bullish crossover). The weekly trend is down when the SPY is below its weekly mid Bollinger band (circled in red on the bearish crossover). SPY has been up 7 weeks in a row and is due for a consolidation. This weeks potential consolidation could mark the half way point of the next move up (see page 2).
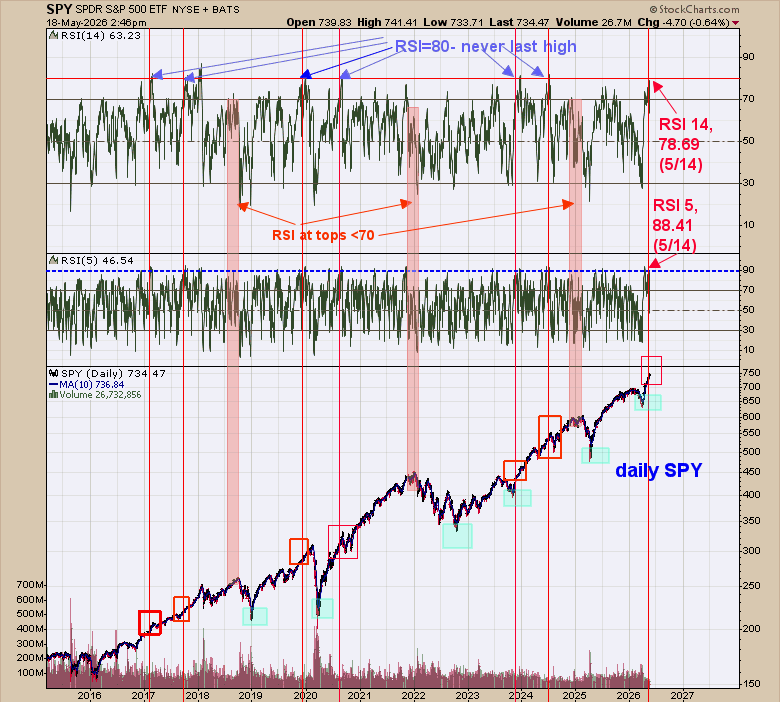
Last Thursday the 5 period RSI reached 88.41 and the 14 period RSI reached 78.69. An RSI (14) of 80 and an RSI (5) of 90 (Last Thusday’s highest RSI 5 and 14 period where shy of just 1.5 points of the bullish levels) suggests the market has strong momentum and never the last high in the market. The RSI (14) reached 80, eight times since 2002 (once ever 3 years) (noted on chart above). Its common for the RSI (14) reading near 80 is that it has marked the half way point of the move up in the past. This week is leading into a three day weekend (Memorial Day Monday and market are closed) and can see less volume this week as trader take off early for the holiday. Light volume pull backs are usually a bullish sign. Could see pull back this week but momentum suggests higher price after holiday.
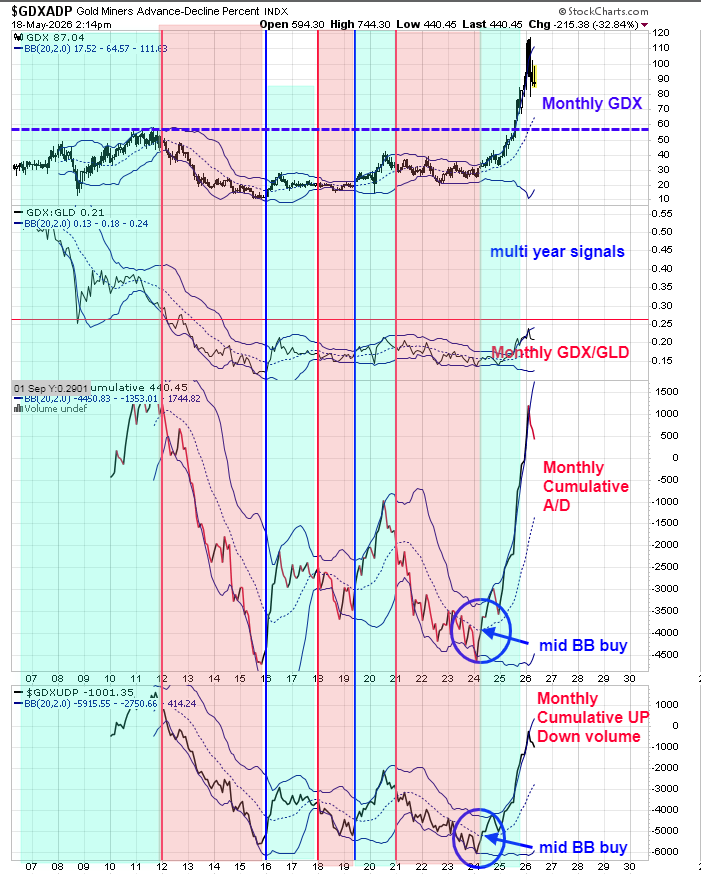
Last Thursday’s report we present the daily Cumulative Advance/Decline and cumulative up down volume for GDX which was on a sell signal. Above is a longer term view for GDX. The bottom window is the monthly cumulative up down volume and next higher window is the monthly cumulative advance/decline (both for GDX). When both indicators are above their mid Bollinger bands the long term trend is up (shaded in green) and when both indicators are below their mid Bollinger bands the long term trend is down (shaded in pink). Even though the short term trend is down (we think more sideways) we are taking the longer term view which is bullish. Long GDX 9/29/25 at 75.76.


Comments
Log in or sign up to join the conversation.