

Stocks finished essentially flat again on Friday, marking the third straight day that the S&P 500 (SPY) has moved by 10 basis points or less. I can’t remember the last time that happened.
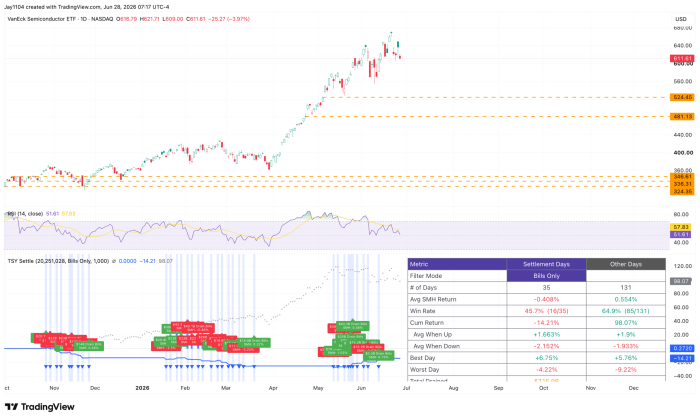
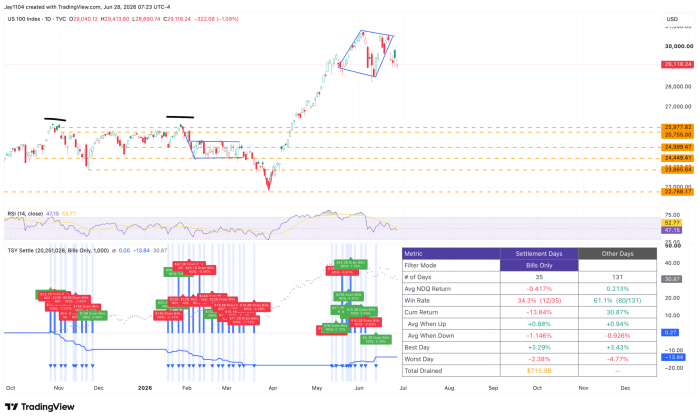
That wasn’t the case for the Nasdaq 100 (QQQ), which fell more than 1% on Friday and finished the week down more than 4%. What’s interesting is that the price action has tracked the Semiconductor ETF (SMH), which declined roughly 7% this week. Semiconductors continue to be the primary driver of the broader market, and as long as that remains the case, the market is likely to stay vulnerable.
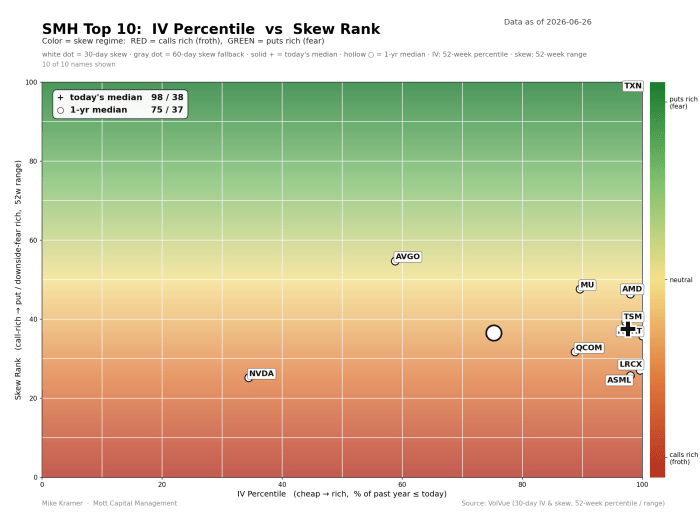
While the distribution has shifted somewhat, the SMH heatmap still shows that the ETF’s top 10 holdings remain relatively elevated in implied volatility rankings.
Liquidity Flows Shift
This week marks a turning point in liquidity flows, at least as they relate to Treasury issuance. On June 30, Treasury coupon settlements will total $64.1 billion, while Treasury bill paydowns will amount to roughly $4.9 billion. Then, on July 2, net issuance returns with a $1.5 billion Treasury bill settlement. Beginning next week, settlement amounts will increase significantly through the end of July and are expected to remain elevated into early September.
Historically, periods of heavy Treasury settlements have not been favorable for the SMH. Since October 28, the ETF has risen on just 16 of the 35 Treasury bill settlement days, with an average decline of 40 basis points. By comparison, it has risen on 85 of 131 non-settlement days, posting an average gain of roughly 55 basis points.
The divergence is both wide and noticeable. While it could simply be the result of chance, the gap in both the percentage of winning days and the magnitude of returns appears too large to dismiss outright. Of course, only time will tell. The longer this relationship persists, the less likely it is to be purely coincidental.
Not surprisingly, the pattern is very similar for the Nasdaq 100, which has risen on just 12 of the 35 settlement days since October 28, or 34.3% of the time, compared with gains on 80 of 131 non-settlement days, or 61.1% of the time. The average move on a settlement day has been a decline of nearly 42 basis points, versus an average gain of 21 basis points on non-settlement days.
Even Driven Week
This week will likely be driven by implied volatility as it rises ahead of multiple headline events, including new Fed Chair Kevin Warsh’s first appearance at the ECB Forum in Sintra on Wednesday, July 1. What has become, in recent years, the ECB’s version of Jackson Hole will feature the familiar central bank policy panel on stage with Warsh, joining Christine Lagarde, Tiff Macklem of the Bank of Canada, and Andrew Bailey of the Bank of England. The discussion begins at 8:00 a.m. ET.
This will be Warsh’s first public appearance outside of an FOMC setting, so markets will be eager to see whether he says anything that differs from his remarks at the post-meeting press conference.
If there’s a day that could be particularly rocky, Wednesday would be it, especially with the June jobs report due on Thursday, July 2. We could see volatility rise sharply throughout the day on July 1 as markets react to Warsh’s comments and, more importantly, hedge ahead of the jobs report.
I expect this to be a very interesting—perhaps long—summer.


Comments
Log in or sign up to join the conversation.