


Equity bulls are positioned well to pull off a decisive breakout on both the S&P 500 and Nasdaq 100. Help may come from rates and crude oil.
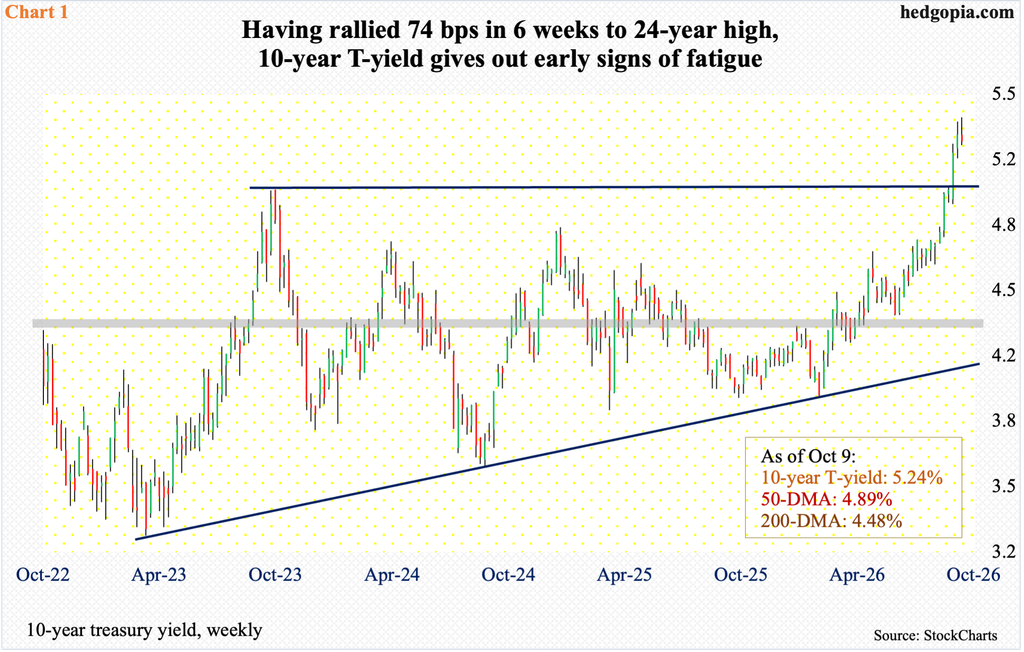
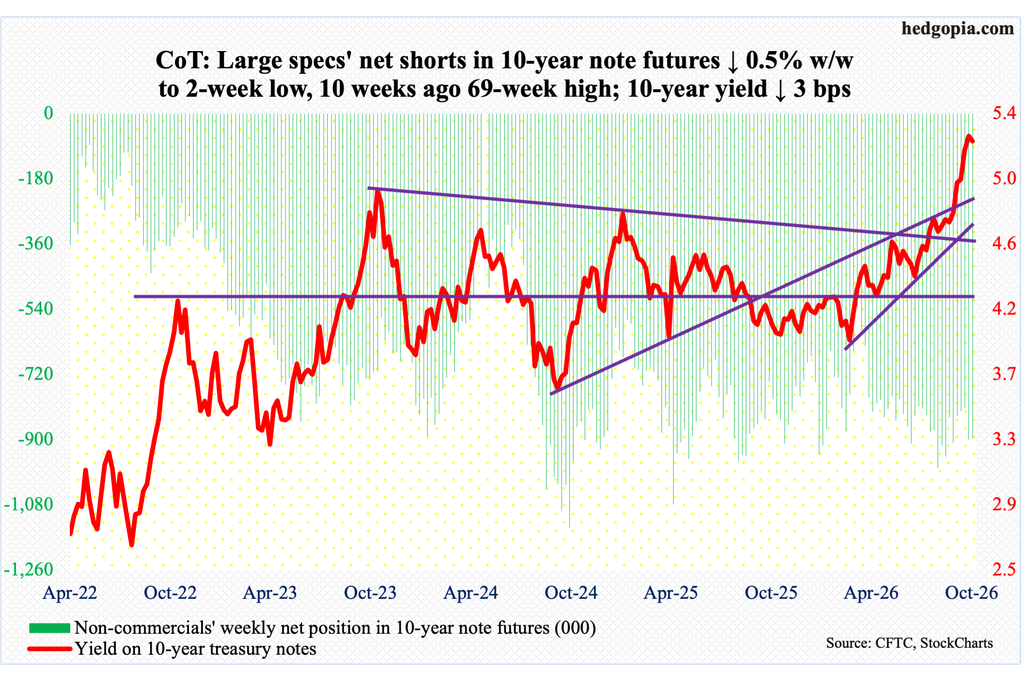
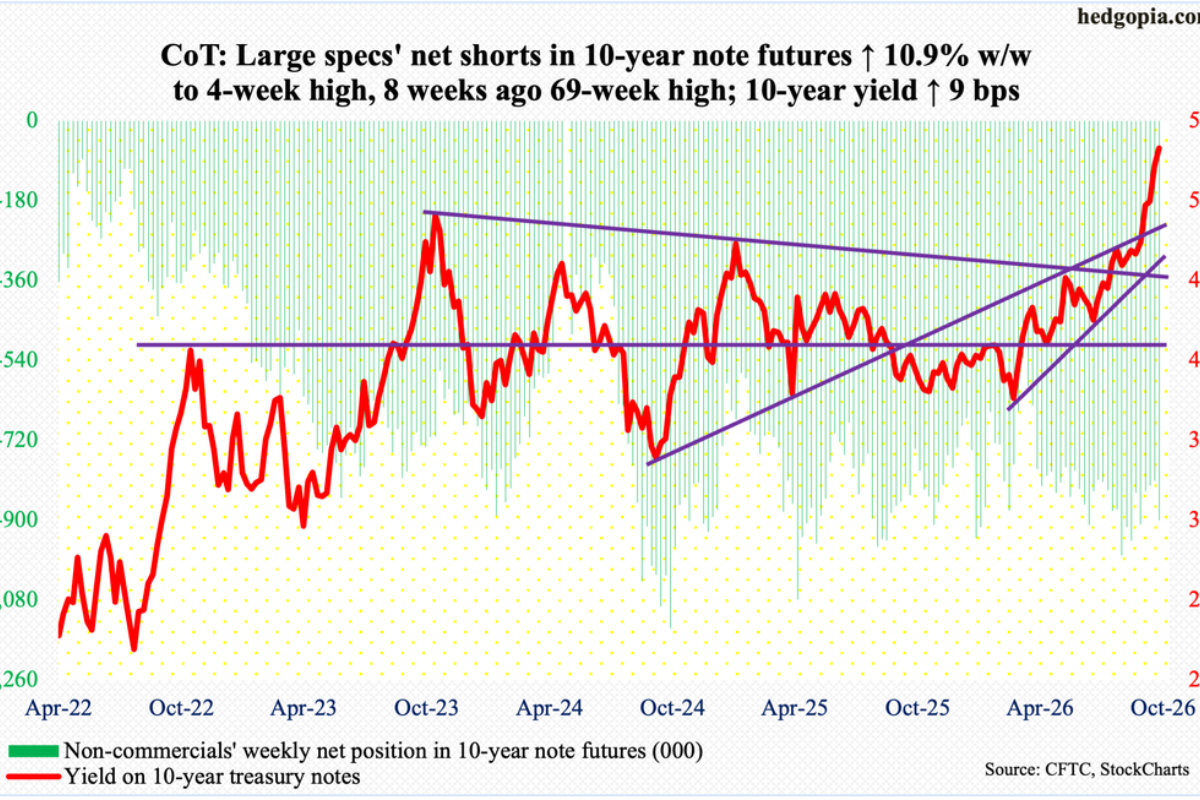
The 10-year treasury yield has had a hell of a move in recent weeks – even months. In September 2024, these notes were yielding 3.60 percent, followed by 3.96 percent in February this year. Last Thursday, the yield ticked 5.36 percent intraday, which was the highest print since April 2002. February’s low was also a defense of a rising trendline from April 2023 when the yield bottomed at 3.25 percent (Chart 1).
September was very strong, as the 10-year rallied 53 basis points. This helped clear the October 2023 high of five percent (4.997 percent, to be exact), which was the highest since July 2007. Last week, the 10-year gave back three basis points to 5.24 percent, and more weakness probably lies ahead.
In the middle of 2022, the 10-year broke a three-decade-plus downtrend and is currently in an uptrend. Within this secular change, cyclical fluctuations will occur. The recent strength has driven these rates into a grossly overbought territory, with subtle signs of fatigue, including bond bears’ inability to hold on to last week’s high, leaving behind a candle with a long upper wick. (In bonds, price and yield move inversely to each other. Hence, bond bears are betting on higher rates.)
In the event the 10-year heads lower in the sessions ahead, five percent is the one to watch for now; bond bulls and bears are likely to do their utmost to defend this level.
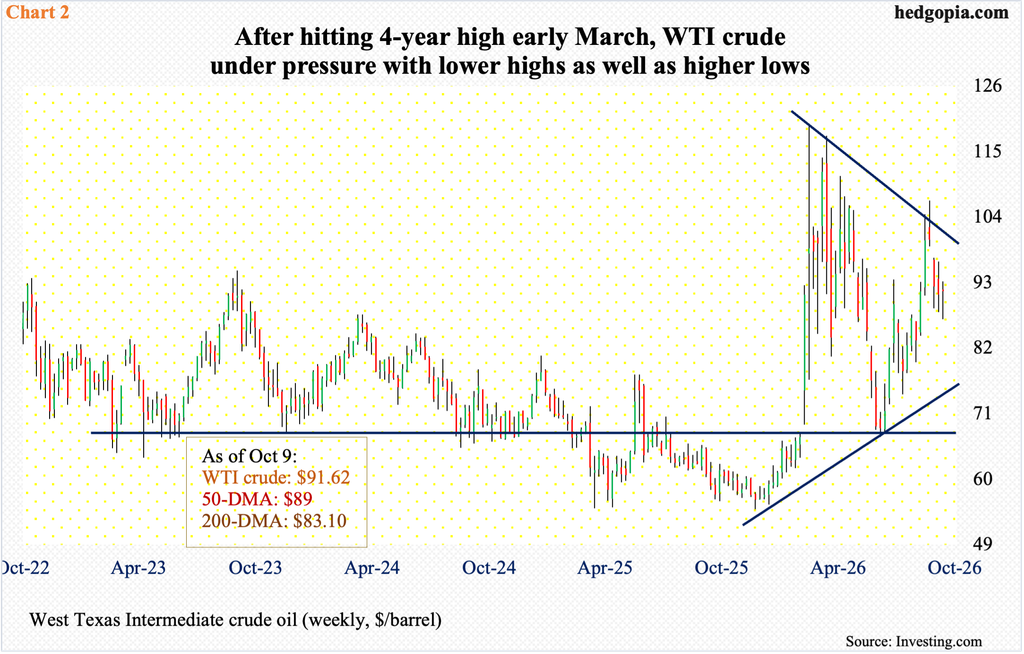
Concurrently, West Texas Intermediate crude finds itself sitting at a crucial juncture. It has gone sideways just above the 50-day ($89) for three weeks now. The crude reversed lower after ticking $106.75 on September 15, although oil bulls thus far have managed to defend the average.
The September 15 high represents a series of lower highs since peaking at $119.48 on March 9 (this year). This followed a six-session surge beginning March 2 when WTI catapulted higher in reaction to the February 28 U.S. and Israeli military attack on Iran (Chart 2); on February 27, it closed at $67.02, with a session high of $67.83 and a low of $64.85; $67 was successfully retested on July 2 with a session low of $67.04.
Last week, after two weekly drops in a row, WTI inched up 0.15 percent to $91.62/barrel, with the bulls defending the 50-day by embracing Tuesday’s session low $86.86. But the crude has not been able to rally off the average for too long now, raising the possibility of a breach soon, in which case the 200-day at $83.10 can act like a magnet.
From equity bulls’ perspective, there is no better scenario presently than both rates and oil coming under pressure – regardless how long it lasts or how high it goes.
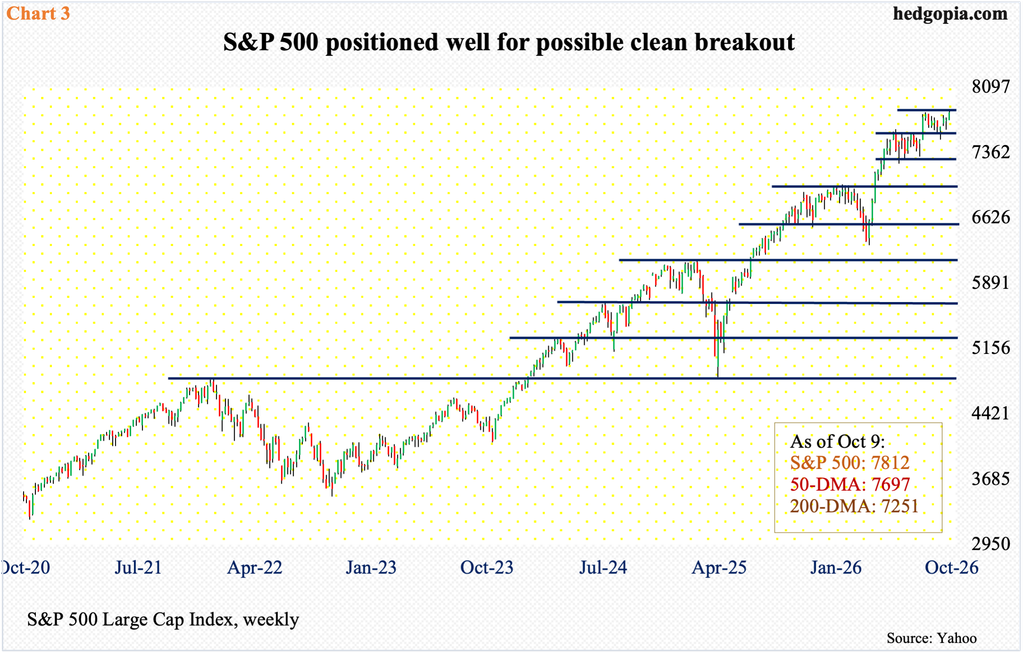
As a matter of fact, bulls have already rallied the S&P 500 and Nasdaq to a level where these indices can decisively break out. The only thing is that in so doing they have already expended a lot of buying power.
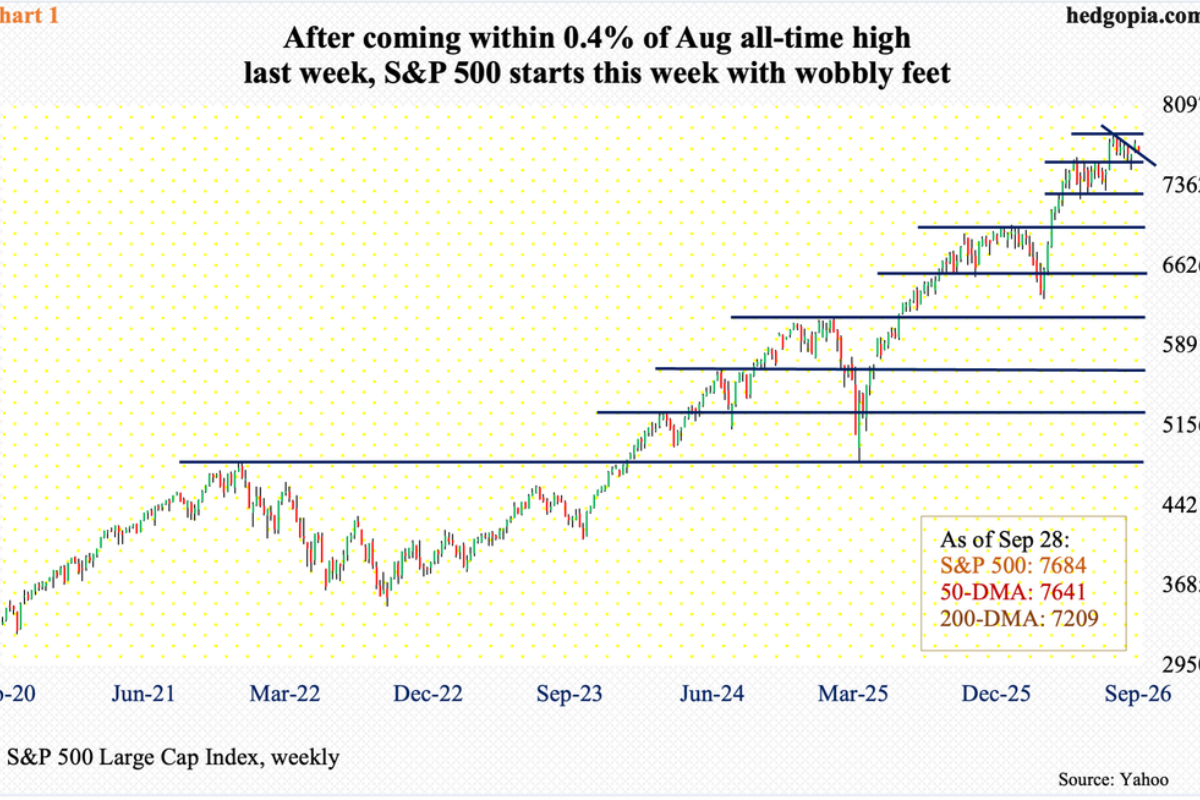
Last Tuesday, the S&P 500 tagged a new all-time high of 7845 – past the prior August 13 high of 7817, although the shooting star session reversed lower to end at 7819. This was followed by Wednesday’s candle which we will find out soon if it is a hammer (bullish) or a hanging man (bearish); Thursday produced a spinning top. In sum, both bulls and bears are sticking to their turf. When it was all said and done, the week was up 1.15 percent to 7812.
The large cap index is overbought particularly on the daily, but the bulls probably deserve the benefit of the doubt. Going into last week, they defended 7600-plus for essentially seven weeks in a row (Chart 3). Earlier, the index consolidated for a couple of months after peaking at 7621 on June 2, followed by a breakout on August 4 and a high on August 13.
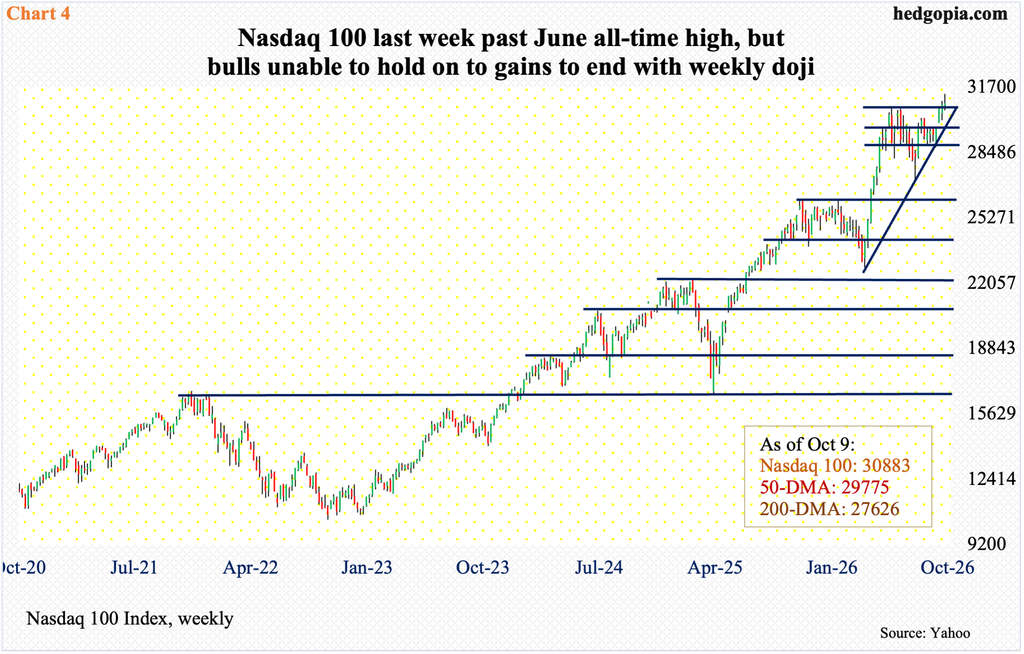
From the viewpoint of a breakout opportunity, the dynamics are similar on the Nasdaq 100. Tech bulls last week only managed to rally 0.2 percent to 30883, unable to hold on to Tuesday’s fresh all-time high of 31361, forming a weekly doji. The candle shows up at a potentially crucial spot (Chart 4).
On June 3, the tech-heavy index peaked at 30762, subsequently bottoming at 27176 on July 29 and then at 28753 on September 16. Six sessions ago, the index edged past the June high, followed by last Tuesday’s new high.
Bulls now have the opportunity to decisively leave behind 30770s, except the fact remains that a little fatigue could set in anytime.
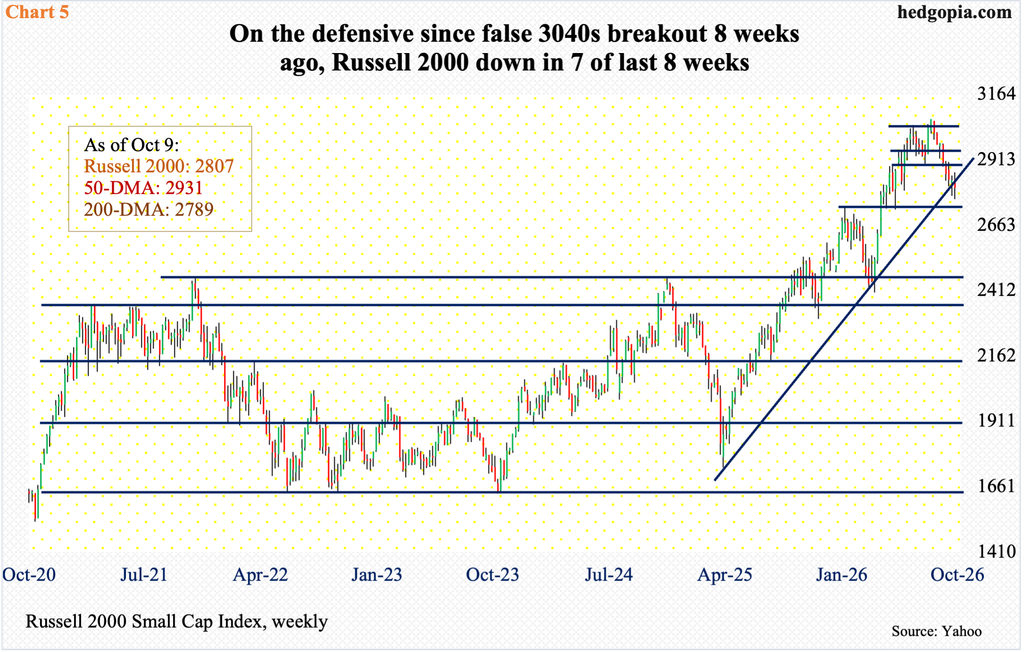
The Russell 2000, on the other hand, is not as lucky as its large-cap cousins. The small cap index remains substantially under its high from August, having suffered five consecutive weekly losses – and seven in eight.
Last week, the index declined 0.9 percent to 2807, versus its all-time high of 3070 from August 14. As the index persisted lower, several support levels were compromised, one of which was 2880s, which last Tuesday was used as a place to sell/go short with the session tagging 2865.
Bulls nevertheless can take solace in the fact that the 200-day (2789) was defended last Thursday, with the session undershooting the average intraday with 2763. The index also sits at trendline support from April last year (Chart 5).
As things stand, small-cap bulls probably have the upper hand.
Comments
Log in or sign up to join the conversation.