

There is no way to know for certain what the stock market will do next, and investors are always dealing with probabilities and possibilities as opposed to certainties when analyzing the market environment. However, the statistical evidence shows that trend following strategies can be quite effective at reducing downside risk through the ups and downs in market cycles.
In essence, trends following means buying an asset when the price is rising - in an uptrend - and selling when the price is falling. The strategy does not work each and every time. Sometimes, an asset is rising and then, it reverses down, so the strategy provides a false signal. However, trend-following strategies have proven to be very effective at capitalizing on strong bull markets and protecting your capital in deep bear markets.
AQR has published a remarkably comprehensive research paper on trend-following strategies and their long-term performance. The paper is entitled A Century of Evidence on Trend-Following Investing, and it examines the risk and returns numbers for trend-following strategies over more than a century of data across different asset classes.
The conclusions from the study are quite powerful:
In this article, the authors study the performance of trend-following investing across global markets since 1880, extending the existing evidence by more than 100 years using a novel data set. They find that in each decade since 1880, time series momentum has delivered positive average returns with low correlations to traditional asset classes. Further, time-series momentum has performed well in 8 out of 10 of the largest crisis periods over the century, defined as the largest drawdowns for a 60/40 stock/bond portfolio. Lastly, time series momentum has performed well across different macro environments, including recessions and booms, war and peacetime, high and low-interest rate regimes, and high- and low-inflation periods
No strategy can outperform versus buy and hold in each and every year, but the statistical evidence shows that trend-following strategies can produce superior risk-adjusted performance over long periods of time. More importantly, trend-following strategies are particularly valuable at reducing portfolio risk during deep and ugly bear markets.
Semiconductors are a crucial sector for the global economy nowadays, and the semiconductor sector is considered a leading indicator for the stock market as a whole. In that spirit, applying trend-following strategies to the semiconductor sector makes a lot of sense in terms of optimizing performance and reducing downside risk in your portfolio.
Why You Need To Watch The Semiconductor Sector
Semiconductors are often the first step in the supply chain for the tech industry, and demand for different kinds of semiconductors says a lot about the prospects for the economy and the stock market. In the same way that the transport sector was considered a key indicator for the economy in the 19th century, semiconductors are now a critical barometer for global economic activity.
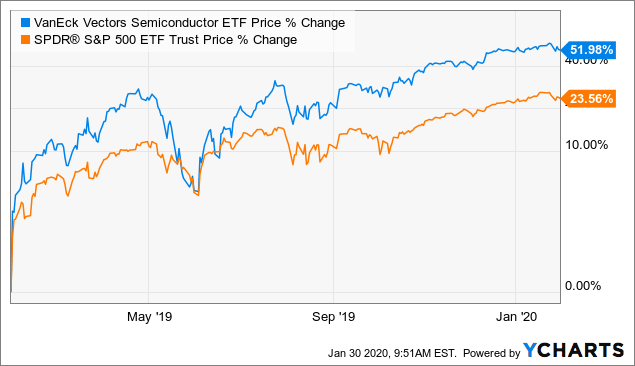
The chart below shows the performance of the VanEck Vectors Semiconductor ETF (Nasdaq:SMH) in comparison to the SPDR S&P 500 Trust ETF (NYSEARCA:SPY) over the past year. The semiconductor ETF tends to find its tops and bottoms before the market-tracking ETF does, and most of the time, semiconductors work as a leading indicator for the market.
Data by YCharts
In order to quantify the relationship between semiconductors and stocks in general, we can build a trend-following strategy based on the relative performance of semiconductors versus the broad stock market.
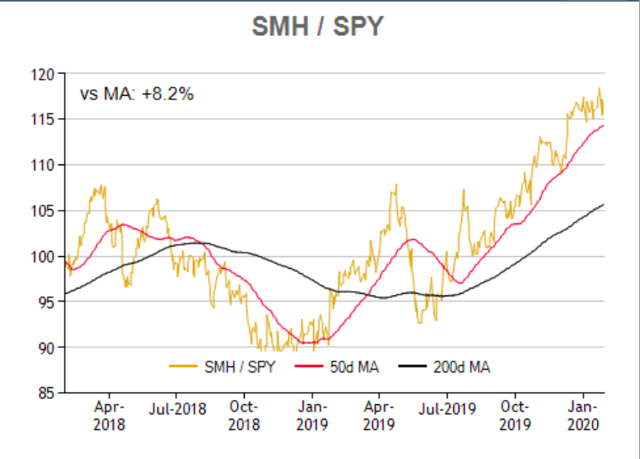
We begin by creating a ratio that measures the relative performance of the VanEck Vectors Semiconductor ETF versus the SPDR S&P 500 Trust ETF. When this ratio is rising, it means that semiconductors are outperforming, which has bullish implications for stocks and other risky assets. Alternatively, when the ratio is declining, this is a bearish signal for risky assets and a bullish signal or safe-heavens such as treasuries.
The chart shows how the ratio has evolved in recent months, with the 50-day moving average in red and the 200-day moving average in black. When the 50-day moving average is above the 200-day moving average, we can say that the ratio is in an uptrend, and vice-versa.
Source: ETFreplay
When the ratio is in an uptrend, the quantitative strategy is invested in the Invesco QQQ ETF (Nasdaq:QQQ). On the other hand, when the ratio is in a downtrend, the strategy goes for safety by investing in the iShares 20+ Year Treasury Bond ETF (Nasdaq:TLT).
The main idea behind the strategy is quite simple: When semiconductors are outperforming, the portfolio is allocated to stocks with above-average risk levels, and when semiconductors are underperforming, the portfolio is allocated for safety in long-term treasury bonds.
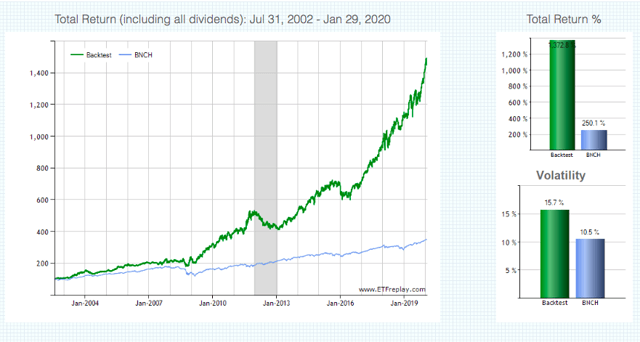
Since August 2002, the first month in which all of the ETFs are available for trading, the quantitative strategy gained 1,372.8% versus a cumulative gain of 250.1% for the benchmark in the same period. The benchmark is a portfolio of 60% global stocks and 40% bonds.
Source: ETFreplay

In annual terms, the quantitative system gained 16.6% versus 7.4% for the benchmark. The maximum drawdown - meaning maximum capital loss from the peak - was 22.6% for the trend following strategy versus a maximum drawdown of 35.4% for buy-and-hold investors in the benchmark.
The long-term return numbers are clearly attractive, and looking at the big picture is always important. However, we also need to consider that a strategy such as this one can underperform considerably in some periods.
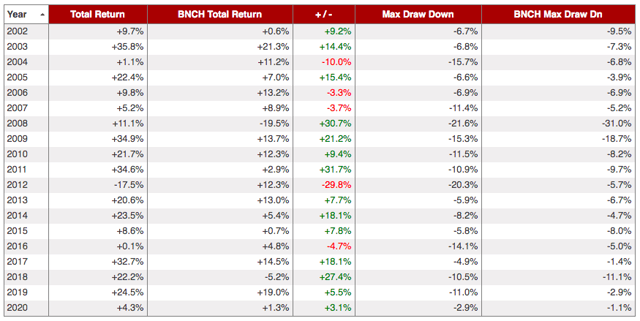
We can gain a deeper understanding of how the strategy works by looking at the annual return numbers since inception.
Source: ETFreplay
The strategy is based on trend following principles, so it generally does very well when the main trends in different assets are strong and well-defined. Conversely, when markets are moving sideways and trends are weak, the quantitative strategy can be expected to underperform.
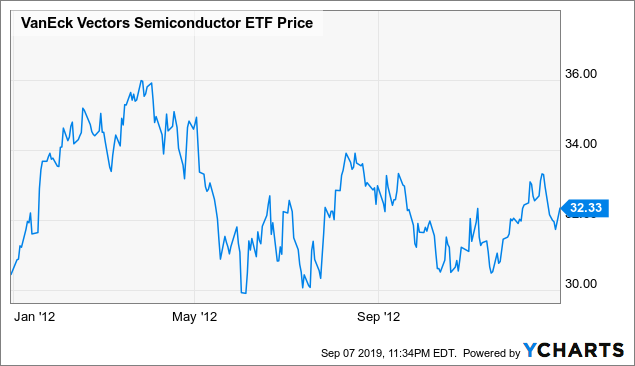
For example, the year 2012 was the strategy's worst year, losing -17.5%. The year 2012 was choppy and undefined for the semiconductors ETF, moving mostly sideways. In this context, the strategy produced several false signals, which had a negative impact on returns.
Data by YCharts
On the other hand, in a year such as 2008, when global stock markets collapsed and the S&P 500 had a maximum drawdown of 47.6%, the strategy gained 11.1% by investing mostly in treasuries and outperforming the -19.5% loss suffered by the benchmark.
High-risk assets had a great year in 2017, and the strategy also outperformed the market by investing in QQQ during the whole year, so the strategy gained 32.7% versus 14.5% for the benchmark.
In plain English, the strategy does not care much about the direction of the market, it can do well when high-risk assets are surging or crushing. However, the strategy needs the direction of the market to be strong and well-defined, because it generally produces mediocre returns when markets are moving sideways and trends are weak.
Reading The Data
Looking at the signals from the quantitative strategy, the 50-day moving average in the semiconductors' relative strength ratio has been above the 200-day moving average since April of 2019, so the strategy is in risk-on mode since then, and it has benefited from remarkably attractive returns from this signal.
On the other hand, we can see that the short-term moving average has been growing increasingly apart from the long-term moving average, signaling vigorous momentum in the trend. The ratio, in fact, made new highs last week, and it makes sense to expect some moderation in the trend over the coming days.
Source: ETFreplay
In simple terms, when looking at the trend following strategy based on the semiconductor sector, it seems like the correction that is taking place in the past few days could have more room to run. Over the long term, however, the trend remains up, and corrections in an uptrend are generally a buying opportunity for investors.



Comments
Log in or sign up to join the conversation.