

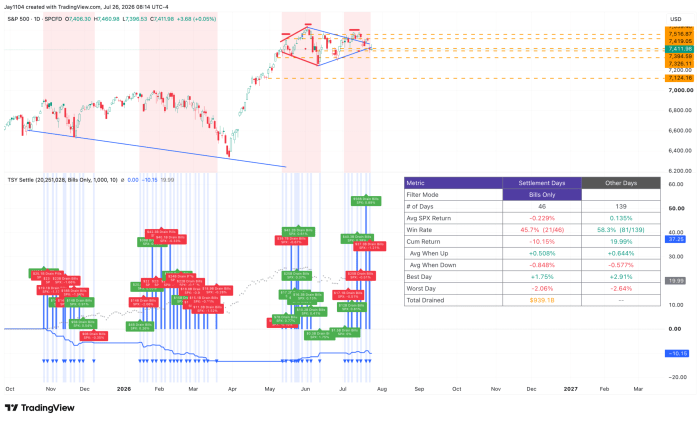
This will be one of the busiest weeks of the year, with a significant amount of liquidity drained from the financial system. On July 28, T-bill settlements will total $70.5 billion, followed by $38.5 billion on July 30 and another $11.6 billion on July 31. In total, roughly $120 billion of Treasury settlements will take place over the three days, with the majority consisting of T-bills.
T-bill settlements continue to weigh on the S&P 500. Since tracking began, only 45.7% of T-bill settlement days have been positive for the index, and the average return on those days has been a decline of approximately 23 basis points.
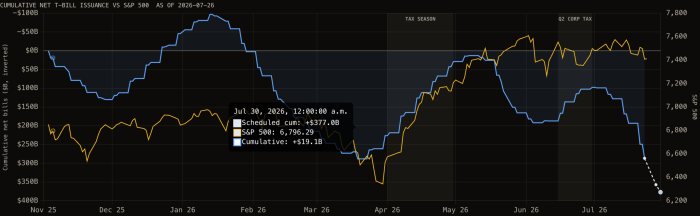
Treasury bill issuance will continue to build even after this week, and liquidity will continue to be drained from the financial system through September. While the weekly pace of the drain should begin to diminish, there will still be substantial bill issuance between now and the September tax payment date.
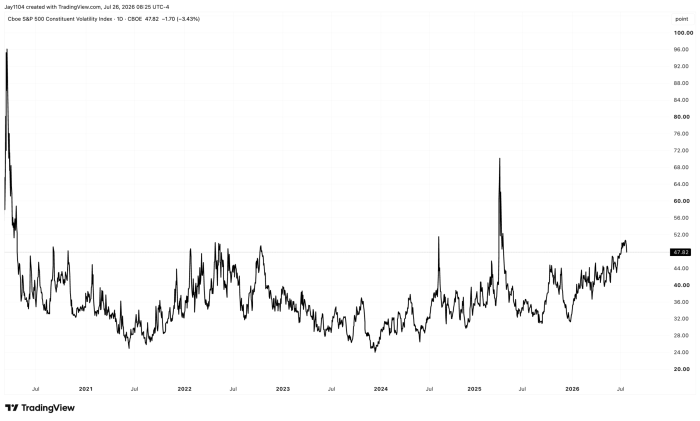
Additionally, single-stock volatility, as measured by the VIXEQ, should continue to decline once the bulk of earnings season is behind us on Thursday afternoon. It fell sharply this past week following Alphabet’s (GOOGL) and Tesla’s (TSLA) earnings reports, but it still has considerable room to move lower from current levels.
The heatmap below shows where implied volatilities (IVs) stand for the 50 largest constituents of the S&P 500 relative to the SPY ETF. Companies that have already reported earnings have seen their implied volatilities decline materially, while those yet to report continue to show elevated IVs ahead of their earnings announcements.
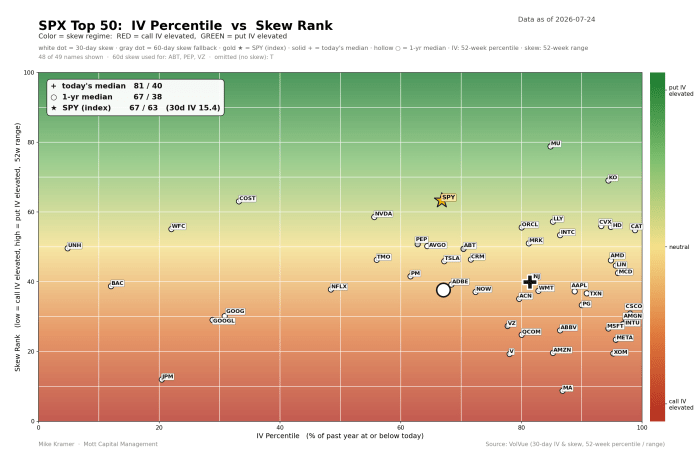
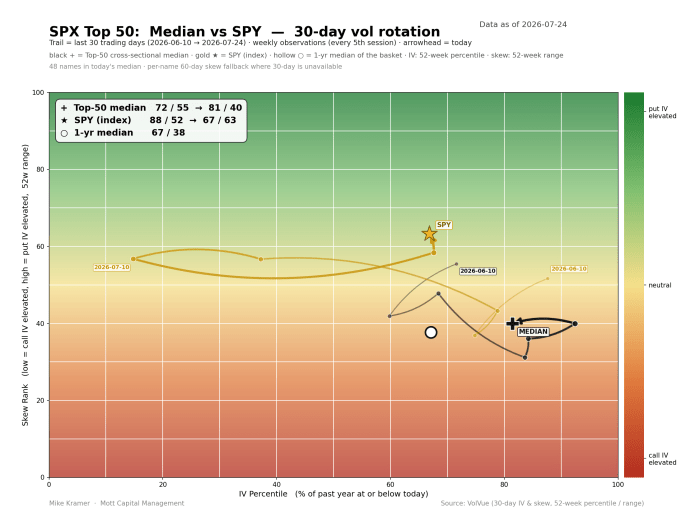
The median implied volatility of the top 50 S&P 500 stocks shifted left on the IV distribution chart this week, while implied volatility for the SPY ETF moved right. That narrowing gap is likely to put pressure on the dispersion trade that has dominated the market in recent weeks, leading to higher correlation among stocks and lower dispersion going forward.
The spread between dispersion and implied correlation remains exceptionally wide. That gap is likely to begin narrowing as more companies report earnings, with the adjustment likely to accelerate following the results from Microsoft (MSFT) and Meta (META) on July 29, and from Apple (AAPL) and Amazon (AMZN) on July 30.
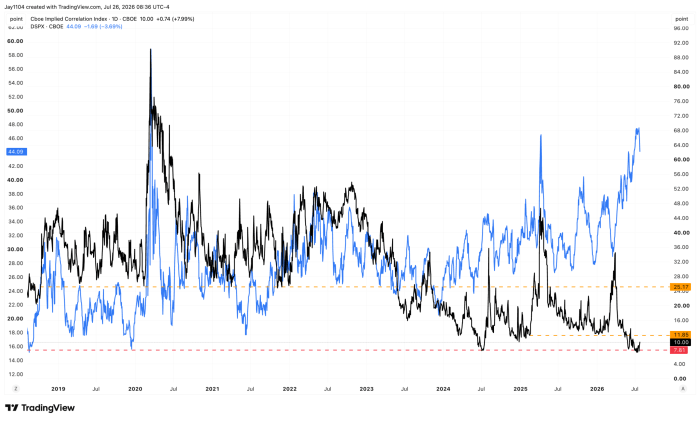
Historically, this spread has been highly correlated with the S&P 500. As a result, periods when the spread narrows have generally coincided with weaker performance in the index.
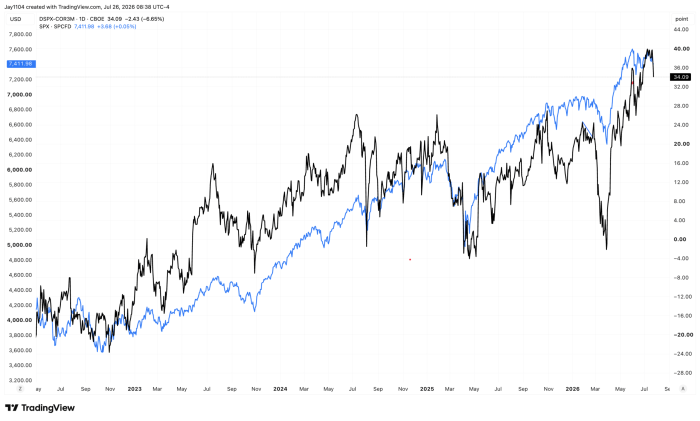
These are two mechanical factors that could weigh on the market. More importantly, with the Federal Reserve’s policy decision due on Wednesday, the 1-day VIX is also likely to rise materially ahead of the announcement.



Comments
Log in or sign up to join the conversation.