

“I did not have this on my bingo card,” quipped John Mauldin.
Shootout at the Inflation Corral
Lacy Hunt has seen enough. But others, including Danielle DiMartino Booth, haven’t.
Mauldin’s reflections stem from his recent Strategic Investment Conference (SIC) where he was shocked to learn Lacy reversed course on bond yields.
Mauldin discusses the bond market bulls and bears in his latest “Frontline Thoughts” newsletter, Shootout at the Inflation Corral
I Felt the Earth Move under My Feet
I think everyone knows that Dr. Lacy Hunt has been a bond bull for 44 years. He turned bullish on bonds as Paul Volcker started raising rates in the early 80s and has stuck to it over time and it is up until recently been the right call. The funds he managed at Hoisington have been the top performing funds off and on for decades. Not so much in the last few years.
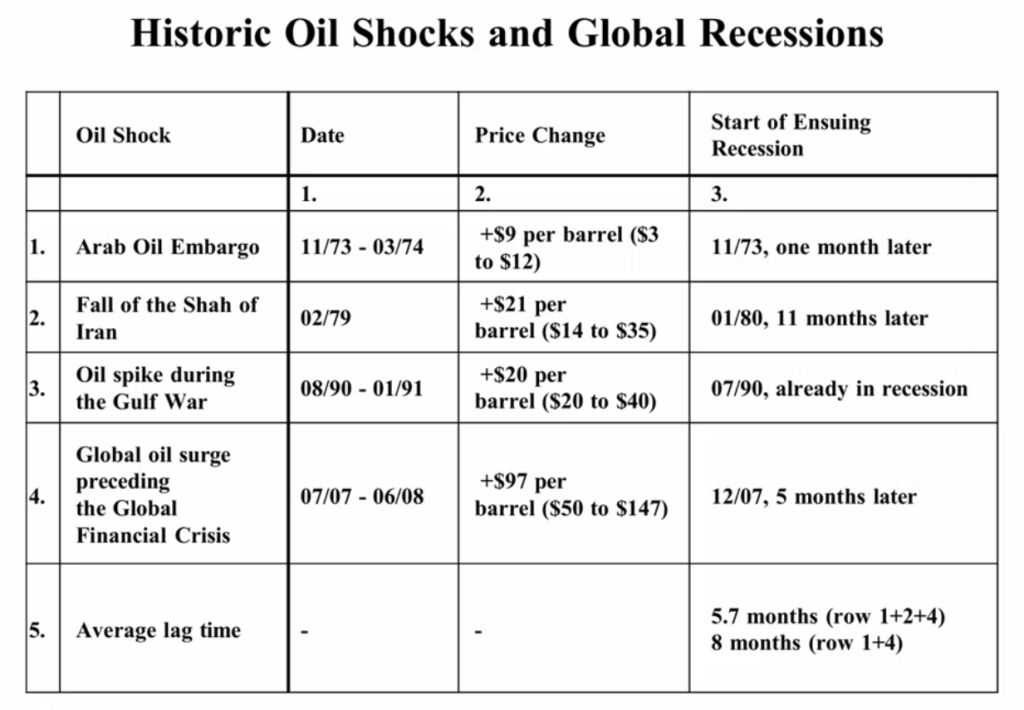
So… 30 minutes before the presentation, I get a note from Lacy basically saying, “I just want you to know that I am going to be making the case for a rise in long-term interest rates.” That started some internal text messaging with my team because this was not on my bingo card. A major 180° change after 44 years? He had two basic reasons, one that everyone is aware of (the oil price shock) and the other was a significant problematic change in Fed policy. When Lacy Hunt starts talking about higher long-term interest rates you have to pay attention. Let’s start with oil first.
By Lacy Hunt’s math, oil prices directly and indirectly account for roughly 12–15% of CPI. If oil prices settle even 20% higher than pre-war levels after the Strait eventually reopens—and I have no particular reason to question Lacy’s arithmetic—that alone could add roughly 240–300 basis points to the price level. Our price shocks have had significant negative effects on the economy.
That inflation pressure is not insignificant, to say the least. Of course, that’s before demand destruction even enters the equation. But the oil shock didn’t arrive in an otherwise clean system. And therein lies the rub…
Starting in mid-December, the Jerome Powell led Fed began purchasing roughly $40 billion a month in Treasury bills, lifting holdings from just under $200 billion to nearly $430 billion by late April.
Impact of Fed Driven Liquidity Impulse
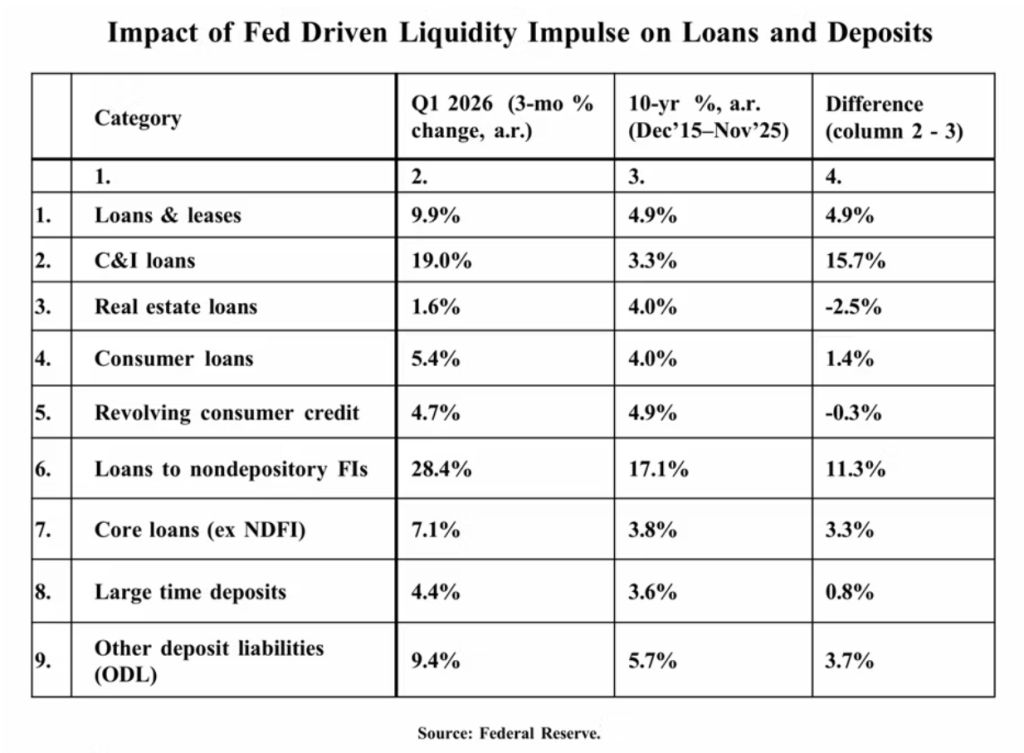
The Fed framed this as a technical liquidity or “plumbing” operation.
Lacy sees that explanation very differently.
“The Fed said that they were upping the bill purchases because the banks were short of liquidity, and this was a technical operation. Nothing could be further from the truth. This was not a plumbing issue. If the banks were in dire need of liquidity… the bulk of those purchases would have gone into idle balances, but they were not. They were directly used and explosively sold.”
I remember asking Lacy and a few others over the last decade why the massive QE and liquidity expansion after the Great Recession didn’t result in an explosion of loans and other bank activities. Partially, it was because the demand wasn’t there and partially the banks were repairing their balance sheets from the aftermath of The Great Recession. That has changed.
This is the part of Lacy’s presentation I kept coming back to afterward.
“In essence, what the Fed did starting in mid-December is they actually were reversing the elements that had been previously pushing the inflation rate generally downward. So now we have the issue of not only solving the oil shock, but we have to unwind the Fed balance sheet as well.” (Emphasis mine.)
I asked Lacy in the Q&A why a 5% move in the Fed balance sheet made a difference. Part of it is answered in this next chart, as it is what is in the balance sheet that makes a difference. They are partially moving from longer-term debt to shorter-term debt.
Federal Reserve holding of Treasury Bills
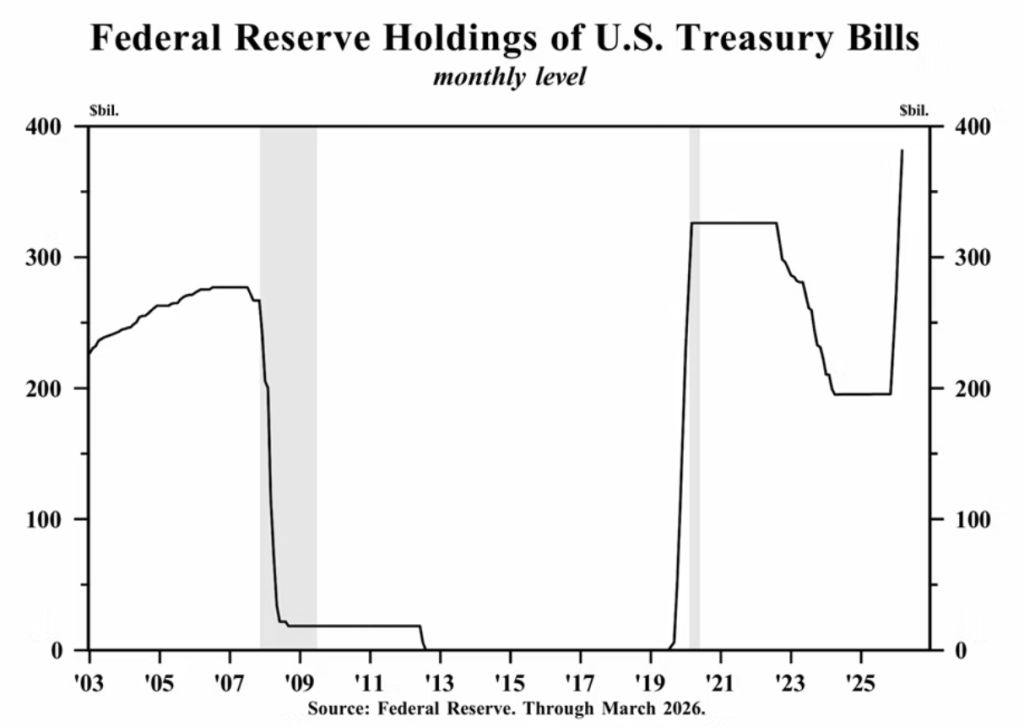
You can see why Lacy thinks this changes the arithmetic rather dramatically.
His inflation outlook is fairly blunt: inflation will climb above 4%, with periods that could push closer to 5% or even 5.5%!!! That’s a very different world than the one investors got used to after 2008. The historical parallel Lacy reaches for is Arthur Burns easing monetary policy into the 1973–74 oil shock, which he views as one of the great policy mistakes of the modern era. The difference this time, in Lacy’s view, is that the Fed began easing conditions before the oil shock fully arrived.
(By the way, I asked Lacy off-line if he agreed with me that Jerome Powell has been the worst Federal Reserve chair since Arthur Burns. He said yes and then said why. A number of other speakers said the same thing to me, but I don’t have their permission this morning to mention their names, but I will try to. If it was just this one mistake, I wouldn’t say that. But his disastrous handling of monetary policy during and after Covid, his 2019 debacle and other various misadventures didn’t speak well for his tenure. I am sure he is a very nice man, educated and thoughtful. But his core understanding of the mechanics of monetary policy and the outcome from his choices leaves something very lacking.
In future letters about this SIC, we will talk about the extraordinarily difficult situation that Kevin Warsh finds himself in as he begins his tenure as Fed chair. I can’t recall a time since Volcker that a Fed chair came into his position with such extreme externalities. If Lacy is right and we see 4.5% or 5% inflation, how can he cut? We will get to that when we talk about interest rates and Fed policy in a later letter.)
Fog Beneath the Surface
David Rosenberg was our leadoff hitter this year (as he has been for almost 20 years) with a presentation titled The Fog of War, though he quickly moved beyond the war itself. In Rosie’s view, what mattered more was oil, and beyond that the economic and financial imbalances already embedded in the system before the conflict even began. Rosie offers a somewhat different view on inflation.
Rosie’s not an inflationista. In his view, the larger danger is recession, not inflation. He pointed out that inflation lingered in 2021–22 because workers had real bargaining power and wages could chase prices higher. That mechanism, he believes, is largely missing today. Several of his charts suggested the labor market may be softening faster than many appreciate, with unemployment expectations already approaching recessionary territory.
Rosie then turned to productivity, which I think is one of the more interesting parts of his framework.
“In the past two years, 92% of the economic growth in the US economy came from productivity. 8% came from labor input… In any given year, what is normal? What is normal is that there’s an even split, 50/50… At those technology peaks, it’s 70% productivity, 30% labor input. This is 92 to 8. How does anybody think that 92% contribution to the economy of productivity… is inflationary?”
He also spent time on the shelter story, which in Rosie’s view still doesn’t get enough attention. Shelter costs, including rents and owners’ equivalent rent, make up roughly 30% of CPI and nearly 40% of core CPI. Real-time housing data already show new lease rents falling, vacancy rates near cycle highs, and home prices cooling.
The problem is that the BLS shelter calculation lags reality by 12–18 months. That means the disinflationary impulse is still slowly working its way into the official inflation data and should continue doing so for some time.
Finally, before the war introduced a new oil shock into the equation, Rosie pointed to the Dallas Fed’s trimmed mean PCE as evidence the inflation problem was already beginning to solve itself. Both the 12-month and 6-month trends were already moving steadily back toward 2%.
As Rosie put it:
“Here’s Warsh’s favorite inflation metric. The underlying-underlying trimmed mean 12-month PCE, the six-month trend, they’re already heading back down to 2% before the war started.”
Revisions, Revisions, Revisions
Danielle DiMartino Booth thinks we should probably stop talking about recession entirely in the future tense. In her reading of the revised data, the US economy may already be in one.
The BLS initially reported 1.7 million jobs created in 2025. After revisions and quarterly census adjustments, that number fell to just 123,000. In Danielle’s framing, eleven out of every twelve reported jobs effectively disappeared. That should probably get more attention than it does.
More importantly, beneath the headline numbers, the private sector posted net job losses in both the second and third quarters of the year.
“You do not have two consecutive quarters of job losses — and this is the hardest data that exists — without the United States economy being in recession. Mark my words.”
Danielle also pointed to consumer data that increasingly tell the same story: flat real retail sales, a depleted savings rate, and growing use of buy-now-pay-later financing not for discretionary purchases, but for utility bills and dental work.
You can see why she believes the Fed is drifting toward an uncomfortable corner. Layer a five-sigma gasoline CPI shock on top of an already weakening consumer, and Danielle sees a central bank trapped between inflation it cannot really fix and a recession it still refuses to acknowledge.
Middle Ground
Let me briefly touch on Barry Habib’s inflation framework as well. Barry has won four out of the last seven Crystal Ball awards from Zillow for the most accurate mortgage interest rate predictions out of 150 economists and has always been in the top five.
Barry’s view is that oil matters and matters a lot. Tariffs matter too, but more as a one-time price adjustment than a permanently compounding inflation cycle.
As he put it:
“Inflation looks like a staircase. One on top of another, every year, higher, higher, higher. Tariffs are different. A tariff is a one-time price adjustment. It’s like one step and it stops.”
Most of the tariffs were imposed last summer, so as those year-over-year comparisons begin rolling off, they eventually become disinflationary mathematically.
He also pointed back to shelter, which still makes up roughly 44% of core CPI and is measured using a BLS methodology that has barely changed since the mid-1980s. Barry believes real-time shelter inflation is running closer to 1% while the official data still shows something closer to 3%. If Barry is right, official inflation data may still be materially overstating real-time shelter inflation. That lag alone should continue pulling reported inflation lower over the coming months regardless of what happens with oil prices.
Thus, his government-calculated CPI inflation forecast is between 3.2% and 3.5%. He would agree that CPI might not be the best measure of inflation, but it’s what we pay attention to. And he has a pretty good track record of forecasting that number.
Mish’s Take
Welcome to the club Lacy.
Things have changed. I have been discussing this for quite some time. I don’t fault Lacy for a late change. I credit him for not clinging to a view he now believes is wrong.
When you have a firm position for 44 years, it is very difficult to make a change.
Yogi Berra famously said: “It’s tough to make predictions, especially about the future.”
I have had several bad recession call predictions. I will have more bad predictions.
The Recession Club
I was fully in DiMartino Booth’s recession camp a couple years back. But when the data changed I changed my call.
Although I thought recession was coming, I was no longer willing to make that call for the near term. That was the right view and it’s still my view.
The question now is not whether there will be a recession, but when and what kind.
For eight months or so, I have been pondering stagflation. Booth still sees a disinflationary recession.
I am still open minded, but things look increasingly stagflationary to me, and have all year. I also take clues from the bond market itself.
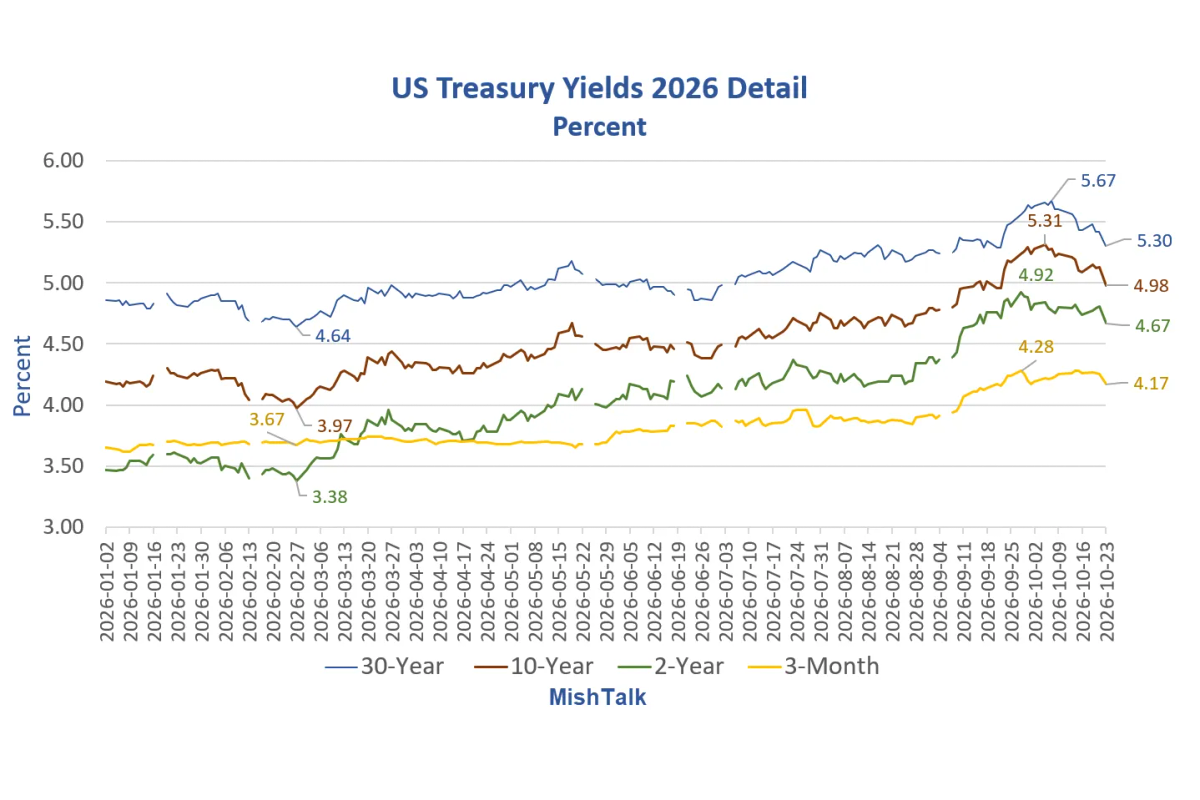
The long bond at 19-year highs should make everyone stand up and take notice.
The Shelter Factor
Barry Habib says “real-time shelter inflation is running closer to 1% while the official data still shows something closer to 3%.”
Rosie says “The problem is that the BLS shelter calculation lags reality by 12–18 months.”
Mish says, “Sorry Rosie, time has expired!”
And alleged “real time measures” are flawed. Truflation makes the same mistake.
Only 10 percent of people move each year, and real-time measures overweight new contracts vs existing contracts.
Two Reasons the CPI Report Will Give the Fed Severe Headaches
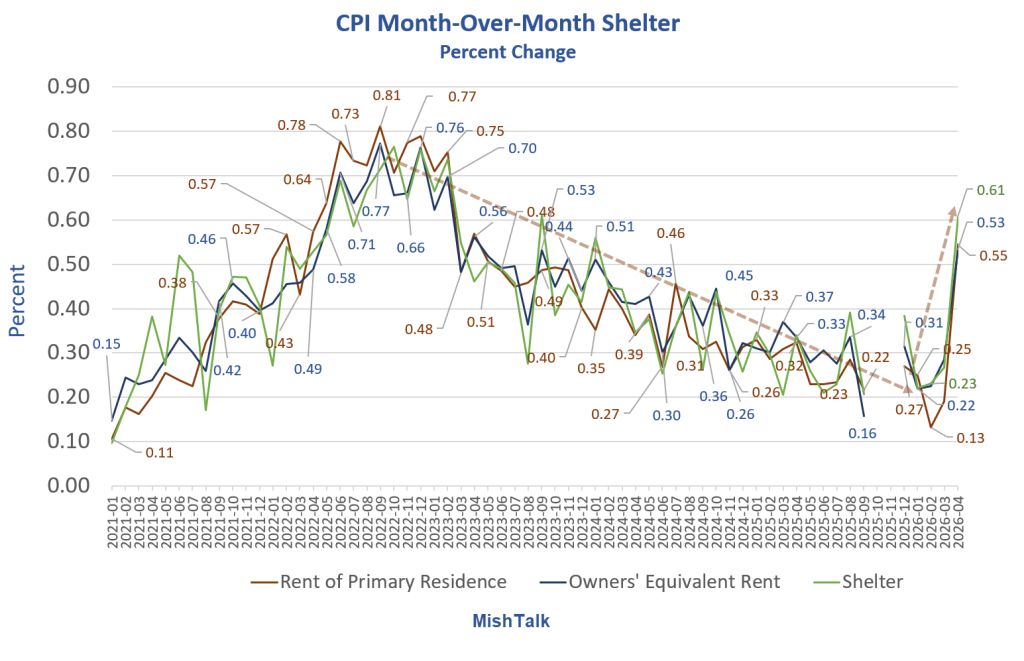
I discussed shelter on May 13, 2026 in my post Two Reasons the CPI Report Will Give the Fed Severe Headaches
There are two very troubling aspects of the latest BLS CPI report. Did you spot them?
Month-Over-Month Shelter Percent Change
Shelter: 0.61 percent
Owners’ Equivalent Rent: 0.53 percent
Rent of Primary Residence: 0.55 percent
Those are all hot numbers. More importantly, the disinflationary trend in shelter appears to be over.
Take Rosie’s 18-month lag. The month-over-month peak was in August of 2022.
CPI Year-Over-Year Shelter
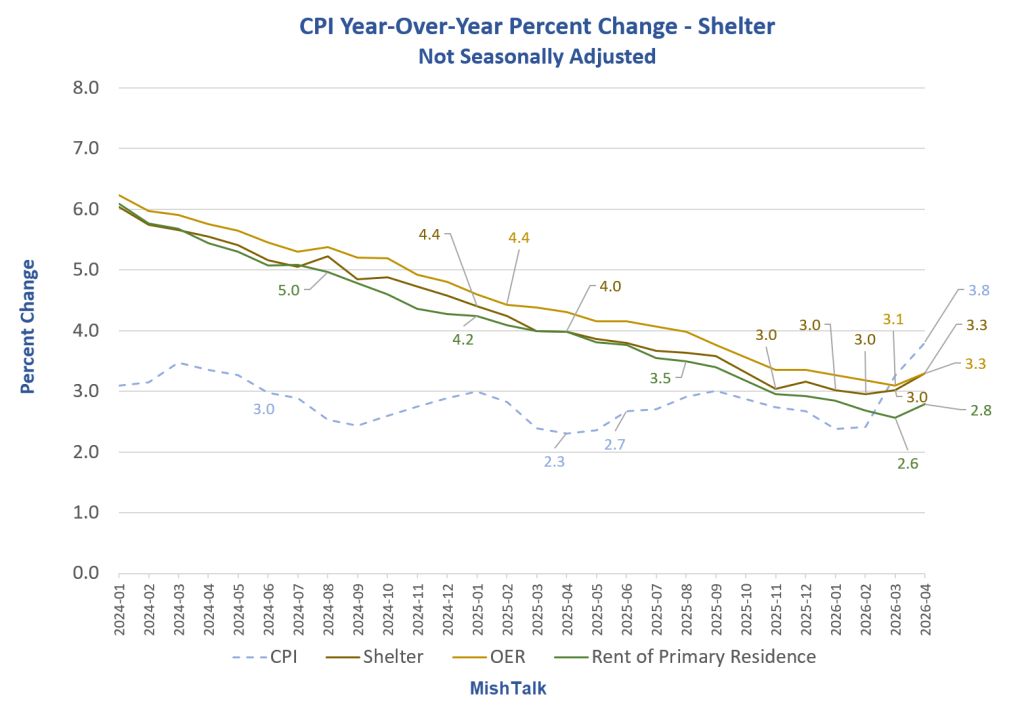
Shelter Year-Over-Year Percent Change Shelter
CPI: 3.8 percent
Shelter: 3.3 percent
Owner’s Equivalent Rent: 3.3 percent
Rent of Primary Residence: 2.8 percent
“If Barry is right, official inflation data may still be materially overstating real-time shelter inflation,” says Mauldin
But what if I am right that the 18-month lag is over.
Shelter Comparisons Looking Ahead
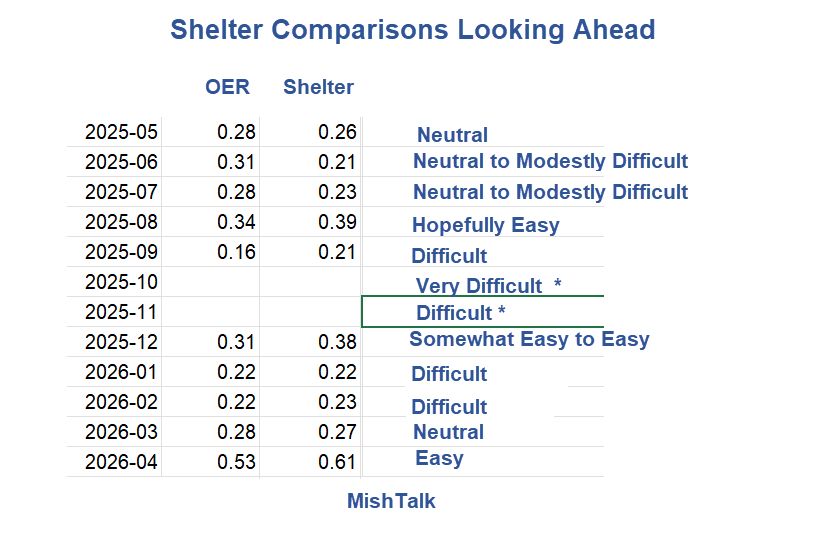
Looking ahead, the year-over year shelter component will depend on the month-over-month number a year ago.
If I am in the ballpark, shelter is going to be adding to year-over-year CPI inflation, perhaps substantially.
If the bond bulls are right, things are at best neutral.
* Key BLS Methods for Rent of Primary Residence and OER
October 2025: Full rent/OER survey collection was suspended. BLS applied the carry-forward method: Rents were carried forward from the April 2025 panel (the last collected data for that rotating 6-month sample). This produced completely unchanged index levels for rent and OER in October (effectively 0% price change imputed).
November 2025: Collection resumed mid-November (Nov 14–30).
November indexes used actual collected November rent data where available.
For the 1-month price change (applied to the flat October level): BLS estimated it as the sixth root of the 6-month price change (May 2025–November 2025) from the November-collected sample. This was then used to set the November index level off the carried-forward October value.
Shelter rose only ~0.2% over the two months Sept–Nov 2025 — one of the weakest readings in years outside major crises. This made shelter/OER appear to flatline or decelerate sharply, with the October zero-imputation “anchoring” the numbers lower.
The Tariff Stairstep
“Inflation looks like a staircase. One on top of another, every year, higher, higher, higher. Tariffs are different. A tariff is a one-time price adjustment. It’s like one step and it stops,” says Habib.
Q: Does that sound plausible?
A: Yes. It “sounds” plausible.
The problem is Trump replaced reciprocal tariffs with tariffs broad-based aluminum, steel, and other tariffs that are even worse.
Trump was twice rebuffed by the courts, fist on reciprocal tariffs and a second time on Section 122 tariffs.
Trump will eventually get his way with section 301 tariffs.
Trump Slams Supreme Court, Orders New 10 Percent Tariffs. How Easy Is That?
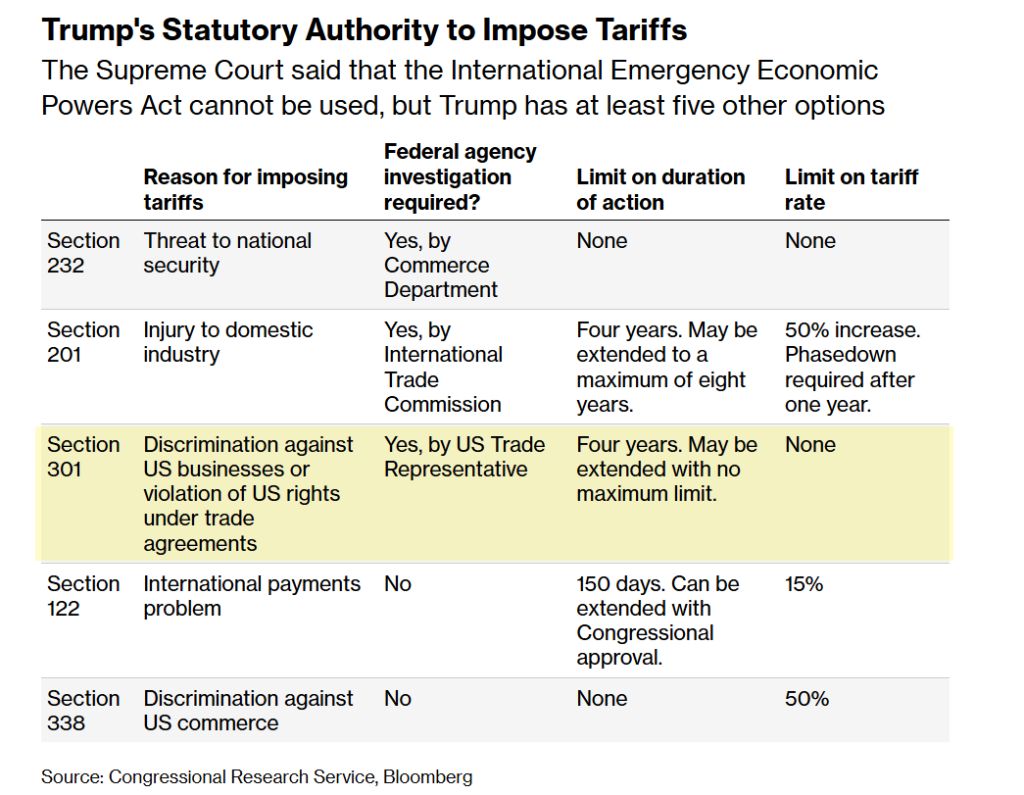
On February 20, 2026, I commented Trump Slams Supreme Court, Orders New 10 Percent Tariffs. How Easy Is That?
Trump has seven other tariff options. What are they?
Section 122 tariffs went down the drain on May 7, as predicted. See Trade Court Sends Trump’s Section 122 Tariffs Down the Drain
Gee, I get another Tariff “I Told You So.”
But ultimately, Trump will turn to section 301 tariffs.
So, I don’t accept this one-time view of tariff inflation because Trump is hell bent on making matters worse.
Let’s now discuss jobs.
Manufacturing Is the Biggest Net Loser in Jobs, 5 Quarters Total
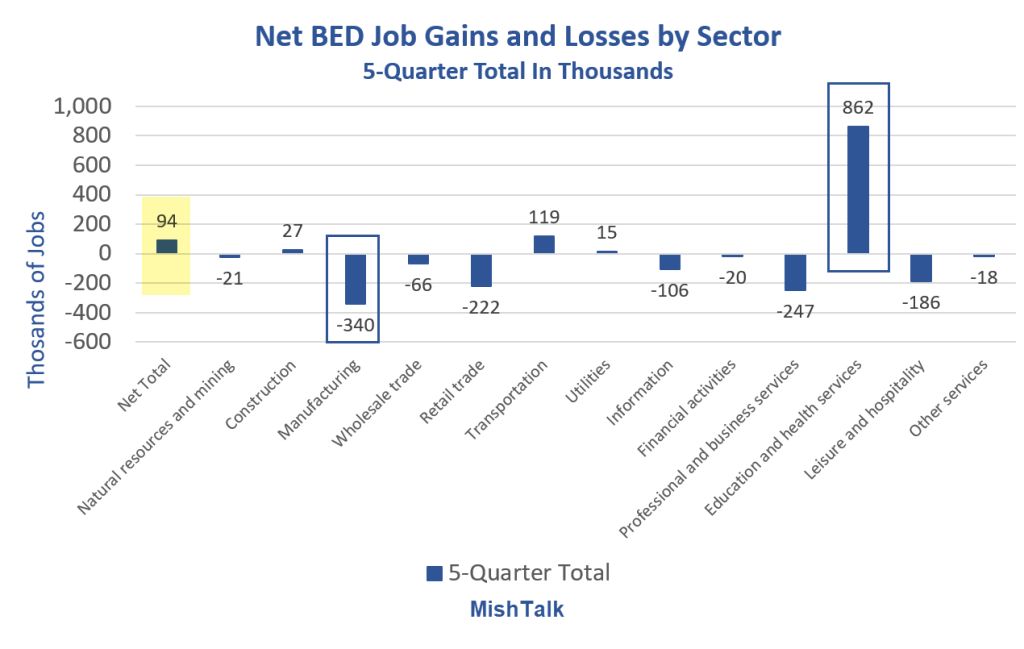
Please consider Manufacturing Is the Biggest Net Loser in Jobs, 5 Quarters Total
Education and Health Services was the only sector to gain jobs in every quarter. It took a massive 862,000 net gain to hold the overall net total barely positive at 94,000.
On average, that is 18,800 jobs per quarter, only 6,267 jobs per month on average.
Manufacturing, and Professional and Business Services are the only sectors that lost jobs every quarter.
BED Manufacturing Jobs Gains and Losses by Quarter Details
2024 Q3: -79,000
2024 Q4: -55,000
2025 Q1: -37,000
2025 Q2: -69,000
2025 Q3: -100,000
In contrast to monthly jobs reports, this lagging data is very accurate.
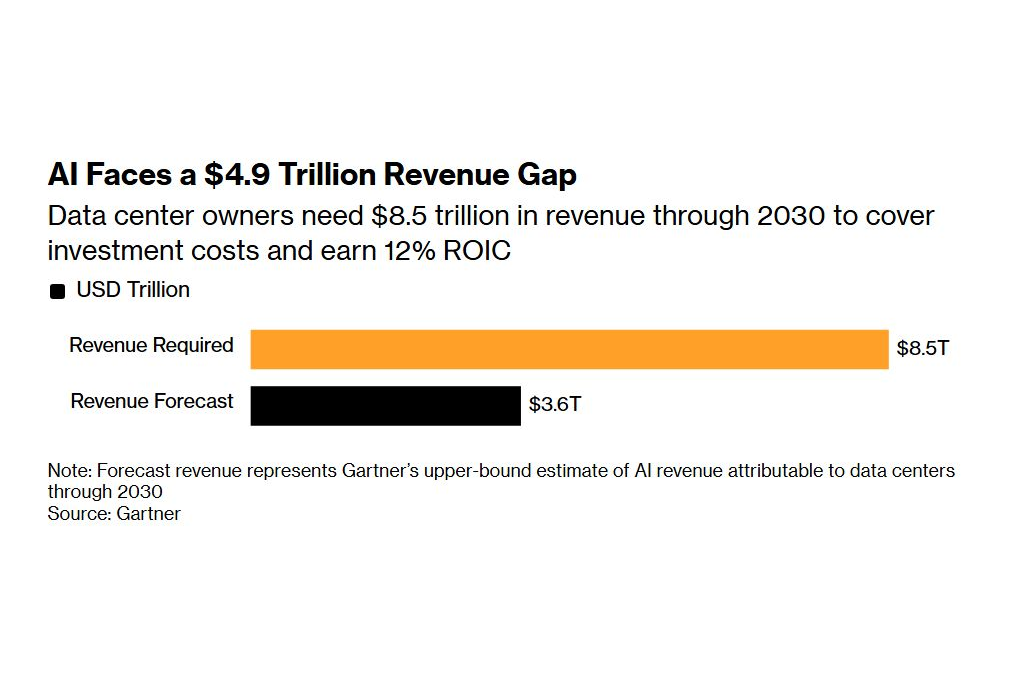
Were it not for AI and boomer health care, this economy would be in the gutter.
So, I certainly agree with Booth about job weakness. Demand destruction will follow, eventually.
Meanwhile, inflation pressures are up across the board, much more so than jobs to the downside.
Trump Twice Says American’s Financial Situations Don’t Matter
That tells you what you need to know about the war, tariffs, and inflation.
Regarding Quantitative Tightening
I agree with Warsh on QT. But he only gets one vote.
I do not expect a policy change soon. So, pay attention to what Lacy is saying here.
Trimmed Mean Inflation TMI
As for trimmed mean inflation TMI that Warsh proposes using, I consider that idiotic.
TMI throws away masses amounts of components at the top and bottom end, but mostly the top, and averages the rest.
I commented on TMI on January 4, 2022.
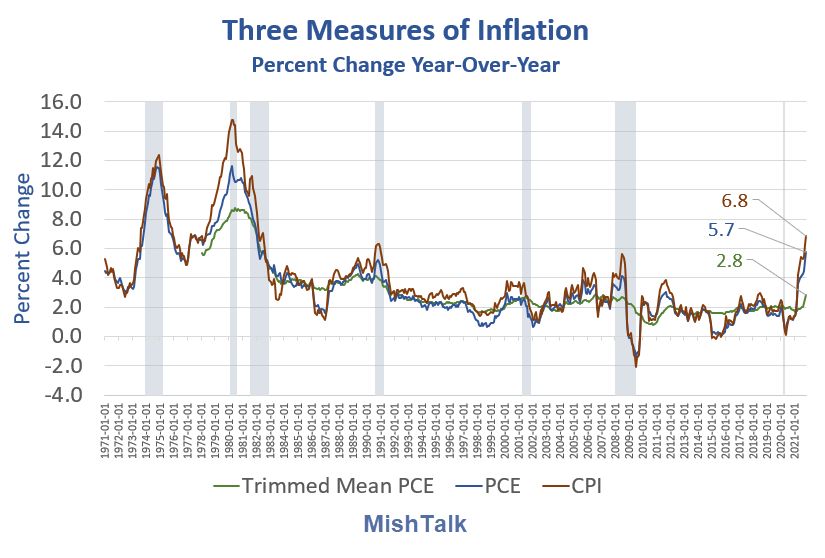
Please consider my January 4, 2022 post (chart above) Trimmed Mean Inflation Is the Ultimate Absurdity in Inflation Measures
Measure Comparison
Essentially the Dallas Fed says lets throw out the top and bottom items of the PCE and average the rest.
The PCE stands for Personal Consumption indicators and is the Fed’s preferred measure of inflation.
PCE differs from the CPI in that it counts expenses paid on behalf of consumers such as medical insurance.
The Consumer Price Index weights rent much higher than the PCE which in turn weights medical higher.
Even with that explanation it’s not quite clear how the Dallas Fed fabricates a preposterous 2.8% year-over-year measure of inflation.
A chart download shows the magic of throwing out “a certain fraction” from both ends to “outperform” conventional measures.
Click on post for more details. Again, note the date January 2022.
Wash beats up on Powell for getting things wrong, but he proposes using an idiotic measure that is as least as bad, in arguably similar circumstances.
“Rosie pointed to the Dallas Fed’s trimmed mean PCE as evidence the inflation problem was already beginning to solve itself. Rosie pointed to the Dallas Fed’s trimmed mean PCE as evidence the inflation problem was already beginning to solve itself,” noted Mauldin.
Yes, just like it did in 2022.
I rest my case. Lacy is now in the right place. Welcome Lacy.

Comments
Log in or sign up to join the conversation.