


South Korea is the world’s 15th-largest economy, but its stock market increasingly looks more representative of a meme stock than a developed economy.
Just think about these various performance figures. Since the end of Q1, the iShares MSCI South Korea ETF (EWY) is up 34%. From its high on June 18th, just over a month ago, EWY is down more than 25%. Despite that decline, though, the ETF is still more than 21% above its 200-DMA, as well as comfortably above its uptrend line that has been in place since late last year.
How you judge the performance of South Korean stocks depends entirely on your time horizon, and a difference of just a few weeks will dramatically alter how performance looks.
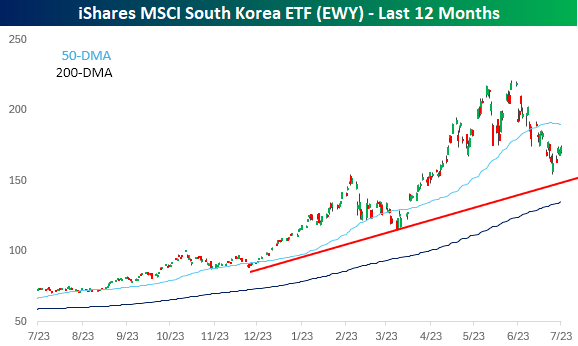
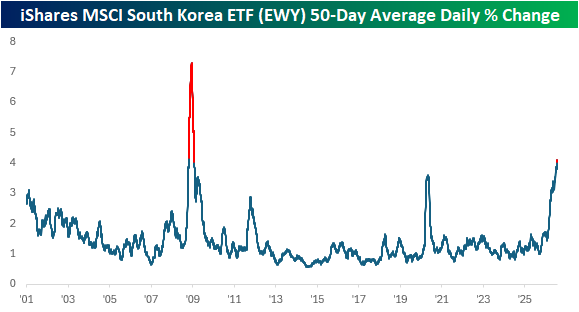
The wide disparity in performance numbers based on differences of just a few weeks is a consequence of massive volatility. As noted in today’s Morning Lineup, 5% daily moves in the KOSPI used to be a notable event, but these days, they’re a normal occurrence. So far this year, EWY has already had 31 daily moves of +/-5%. Since 2001, the only other year that saw more moves of that magnitude was 2008, with 43. This year trails that total by just 12, and there are still more than five months left this year!
With the increased frequency of large daily moves, EWY’s average daily change over the last 50 days has moved above 4%. Since the start of 2001, the only other time that average was at similar or higher levels was in the heart of the Financial Crisis during 67 days from October 2008 through January 2009.
For people who were in the market at that time, it was widely considered one of the most volatile periods in market history. We’re still a ways from that peak level of volatility in the Financial Crisis, but for South Korea, BTS, as in Big Time Swings, is all the rage.


Comments
Log in or sign up to join the conversation.