


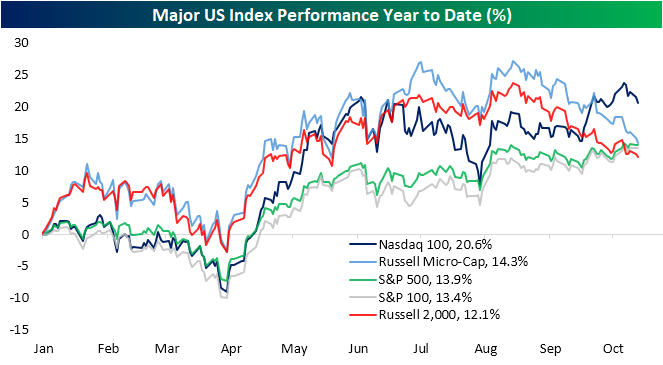
As we discussed in an earlier post, large-caps have been outperforming small-caps recently. As shown below, year to date it is the Nasdaq 100 that has rallied the most, up over 20%. Up until recently, small-caps and micro-caps were in the lead, but they've both been fading since the summer as large-caps have continued to push higher.
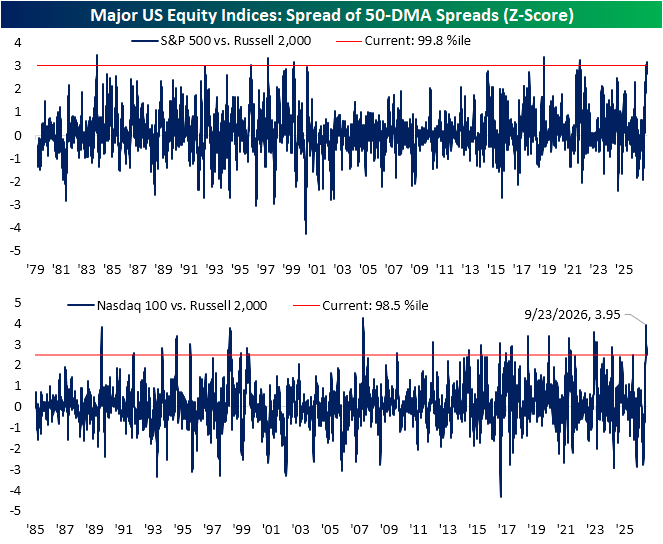
Coming into today, small-caps were trading well below their 50-DMAs in oversold territory, while large-caps were trading well above their 50-DMAs in overbought territory. As shown below, it's rare to see such a wide divergence in these measures.
In fact, the spread between 50-DMAs for the S&P 500 versus the Russell 2,000 and the Nasdaq 100 versus the Russell 2,000 are in the 99th and 98th percentile of readings, respectively.
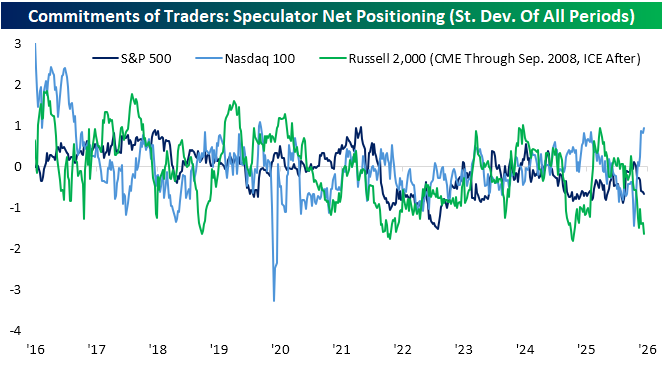
Based on speculator positioning, investor sentiment towards large-caps and small-caps is disconnected as well. In last night's Closer, we recapped the latest positioning data from the CFTC's Commitments of Traders report. We typically express this data as the net share of open interest that is long or short in various futures contracts. As shown below, positioning for small caps has gotten overwhelmingly net short at -20%; the lowest since August 2025. Meanwhile, the Nasdaq has seen a surge in long bets as net positioning just reached its most optimistic levels since July 2020.
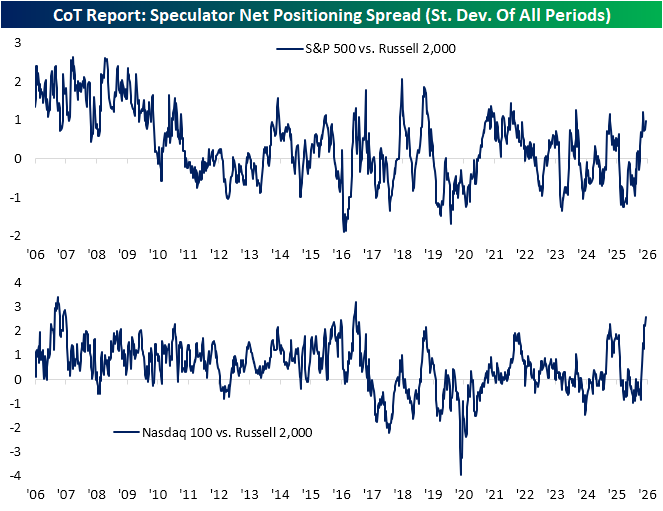
Taking the standard deviations of these readings and comparing large caps (the S&P 500 and Nasdaq 100) to small caps (the Russell 2,000), current spreads are historically wide. The S&P 500 versus the Russell is just off of peak readings from early September, but nonetheless, sits in the top quartile of readings over the history of the CFTC data. The Nasdaq, on the other hand, indicates the highest share of long bets relative to small caps in almost a decade (April 2017).



Comments
Log in or sign up to join the conversation.