


old hasn’t been able to catch a break lately, and since its latest failed attempt to get back above the 50-DMA on 11/10, prices have pulled back more than 10%, pushing it further into the red for the year. As a reminder, gold was up over 20% YTD earlier this year.
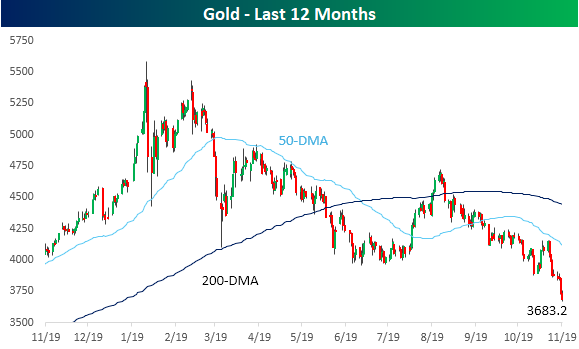
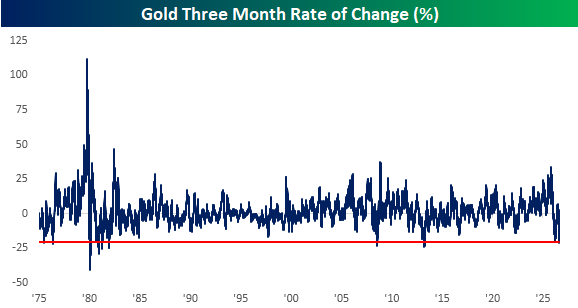
Recent action has been especially painful for gold, and based on current levels, it is now trading down more than 20% in just the last three months. Earlier this year, gold’s three-month decline from its peak came close to 20% but fell just short. If current levels hold, it would be the first decline of that magnitude since June 2013.
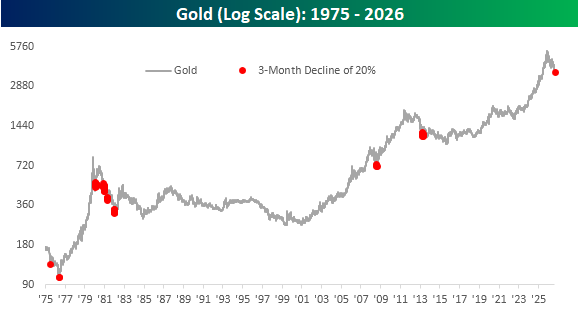
Gold has been considered a store of value for thousands of years, so to see a decline of this magnitude is shocking. As the final chart illustrates, there have only been a handful of prior occurrences in the last 50+ years when it declined by at least 20% in three months.
In the short run, any number of factors could explain a sharp drop in gold, but with such a sustained and persistent decline, the market and the Fed seem to be on different pages with regard to inflation. Fed officials have expressed concerns about being behind the inflation curve, but with gold deflating at the fastest rate in more than a decade, the market would argue otherwise.


Comments
Log in or sign up to join the conversation.