

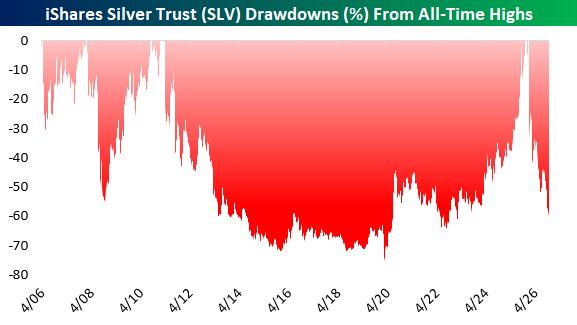
Silver has had a rough go of it this year, and the losses have piled up quickly. After rallying more than 500% from its September 2022 low to its record high on January 28th, the iShares Silver Trust (SLV) has since given back nearly 60% of its value. The selling started almost immediately, with SLV plunging 28.5% on January 30th alone. By June 24th, just 101 trading days after its peak, the ETF had already fallen 50%. A 28% rebound off the initial selloff didn't last long either. As of Monday's close, SLV was back down 50.1% from its late-February relative high and 59.9% from January's record.
As dramatic as the recent decline has been, silver has a history of these types of drawdowns. The chart below shows SLV's performance relative to its prior all-time highs going back to 2006, and one thing that stands out is just how much time the ETF has spent well below its prior peaks. Following its April 2011 high, SLV went more than 14 years without setting another record, finally breaking through in October 2025. At its worst point during that stretch, the ETF was down more than 75%!
The table below looks at every instance since 2006 when SLV first closed at least 50% below a prior high. In addition to drawdowns from all-time highs, we also include declines from relative highs established after rallies of at least 20% off a prior low. Including the two ongoing drawdowns, there have been eight such occurrences. At just 101 trading days, the latest 50% decline from an all-time high was the fastest of any of them, even beating the 153 trading days it took during the Financial Crisis.
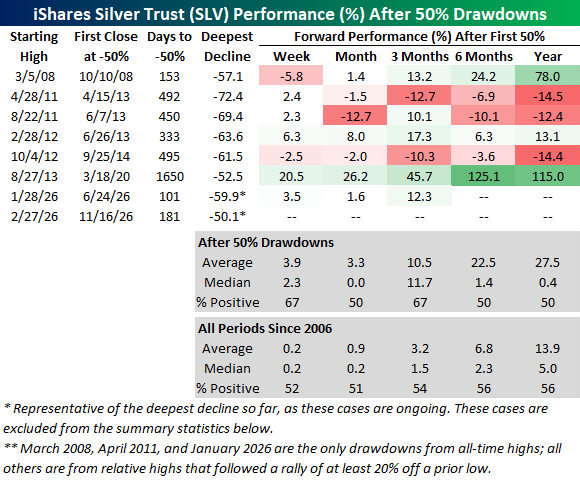
For investors looking for a silver lining, forward returns following these declines have generally been better than average, but the results are not consistent given the small sample size. Across the six completed cases, SLV averaged gains of 3.9% over the following week, 10.5% over three months, and 22.5% over six months, all well above its historical averages for those periods. One year later, the average gain was 27.5%, nearly double the 13.9% average for all one-year periods since 2006. Before getting too excited, though, that average was heavily influenced by the 78% rally following the 2008 decline and the 115% gain after the March 2020 selloff. The median one-year return was just 0.4%, and only three of the six cases were positive.
The aftermath of the 2011 peak is a good reminder that a 50% decline doesn't necessarily mean the worst is over. When SLV first crossed that threshold in April 2013, it still had another 41% to fall from that point before finally bottoming in December 2015. Four of the six completed cases in the table occurred during that extended bear market, and three of those four were lower a year later. After falling nearly 60% in less than a year, silver has certainly taken a beating, but history shows that even after a decline like this, a sustained recovery is hardly a slam dunk.

Comments
Log in or sign up to join the conversation.