

Last month, the BLS reported a stunning gain of 162k jobs in August. Accordingly, economists began to think the job market malaise may finally be thawing. The latest BLS report makes the August data seem like a one-off blip versus a trend change. Last Friday’s report showed a pick-up of only 29k jobs, about a third of the consensus, and the unemployment rate climbed to 4.2% from 4.1%. Further pointing to weakness, average hourly earnings edged up five cents to $37.81, a 0.1% gain, which equates to a decline in wages on an inflation-adjusted basis.
The revisions to prior data were also poor. August’s reported gain of 162,000 was cut to 133,000. July, already revised down twice, flipped from a gain to a 10,000 loss. Together, the two months are 60,000 lower than previously reported.
There were some positives. For instance, labor force participation rose to 61.8% from 61.4%, and the employment-population ratio improved to 59.2%. The higher unemployment rate reflects people entering the workforce, not a wave of job losses.
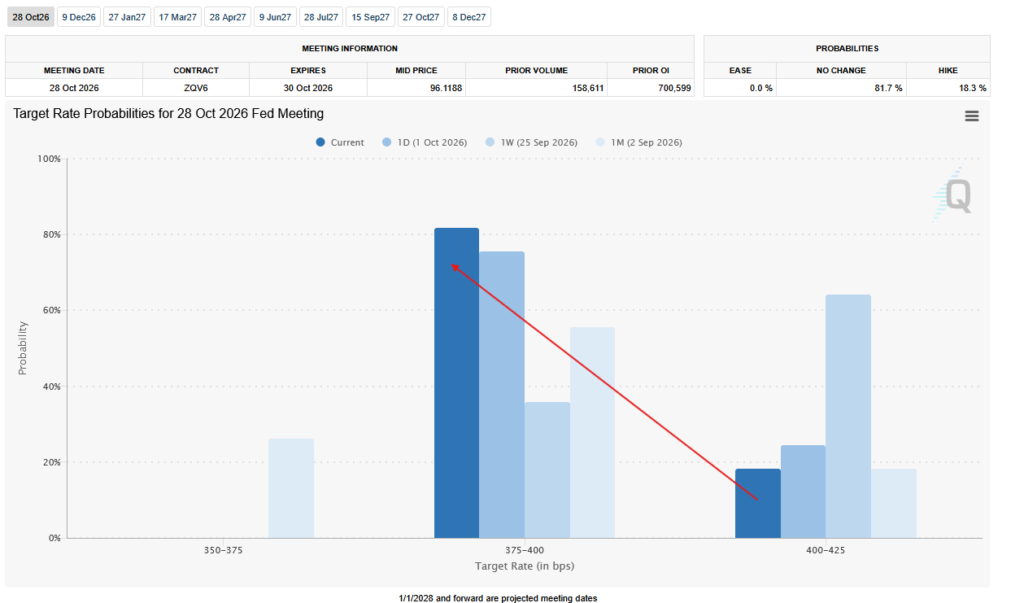
For the Fed, this complicates the case for those members arguing for more. Lorie Logan told an audience last Tuesday she estimates another “50 basis points or more” is needed, citing a labor market “close to most estimates of the lowest sustainable level.” A twelve-month average of 10,000 jobs a month makes that harder to sustain. The market case for more tightening thinned considerably in a few days. As shown below, the odds of the Fed holding rates steady at its next meeting rose from 18% to over 80%.
What To Watch Today
Earnings

Economy
Market Trading Update
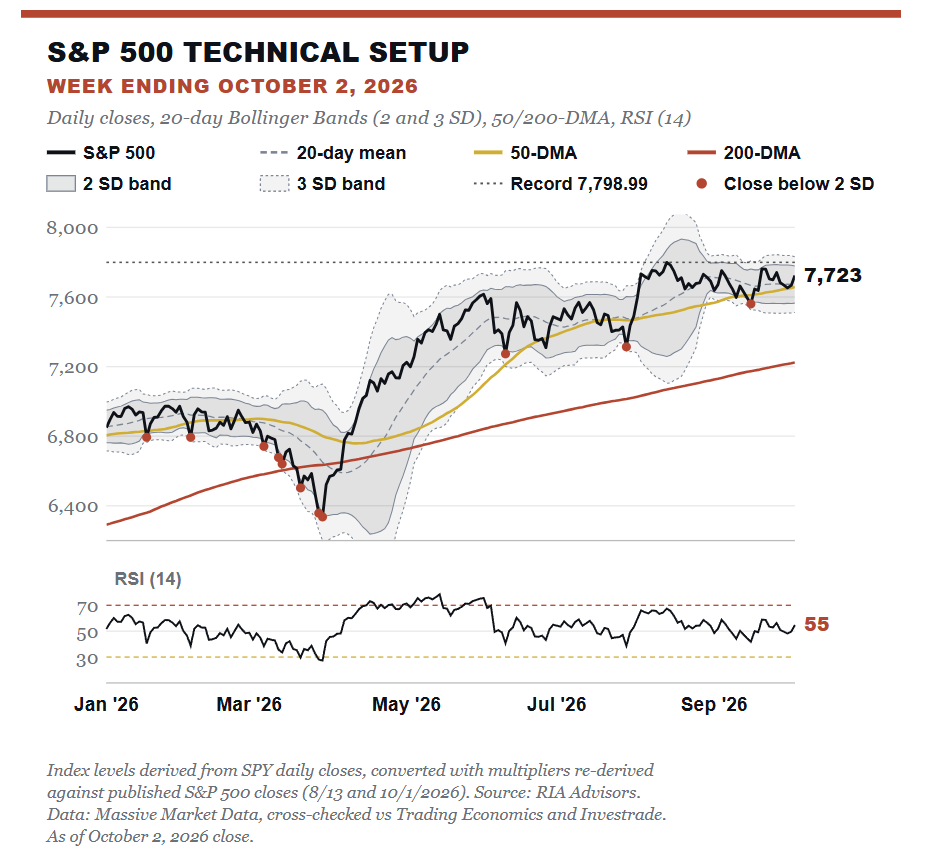
The S&P 500 closed Friday at 7,722.72, down 0.3% for the week. It’s still trapped inside the range that has held since early August. That range runs from the September 16 closing low near 7,560 up to the August 13 record of 7,798.99. The index sits 0.9% above its 50-DMA at 7,658 and 6.9% above its 200-DMA at 7,224. The 14-day RSI reads 55, squarely neutral. MACD is still positive at about 10 index points, but slipped just below its signal line this week. That’s a mild loss of momentum rather than a breakdown.
The Bollinger Bands tell the same story. Price sits about one standard deviation above its 20-day mean of 7,672. The upper 2 SD band is at 7,778, just under the record. Such is the problem with this range. The upper band and the record converge at the points where sellers stepped in on August 13, September 3, and September 21. Until the index can close above that zone, rallies toward 7,800 are places to trim rather than chase.
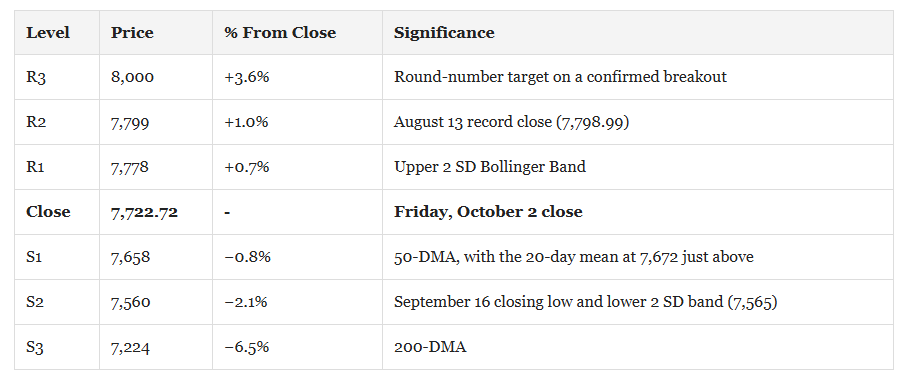
The technical support and resistance levels remain key this week as the Q3 earnings season gears up. All-time highs remain within reach, and support sits immediately below market prices.
The bigger issue is underneath the index. Only two of the 11 S&P 500 sectors, technology and energy, closed above their own 50-day moving averages on Friday. Technology sits 7.2% above its average. Real estate (−7.1%), utilities (−6.7%), and financials (−5.8%) sit deep below theirs. The ratio of equal-weight to cap-weight has dropped 4.4% since June 30. That’s a narrow tape. When one sector carries the market while nine others trade below their averages, the index can hold up for a while, but it grows more vulnerable to a stumble in the handful of mega-cap technology names doing the lifting.
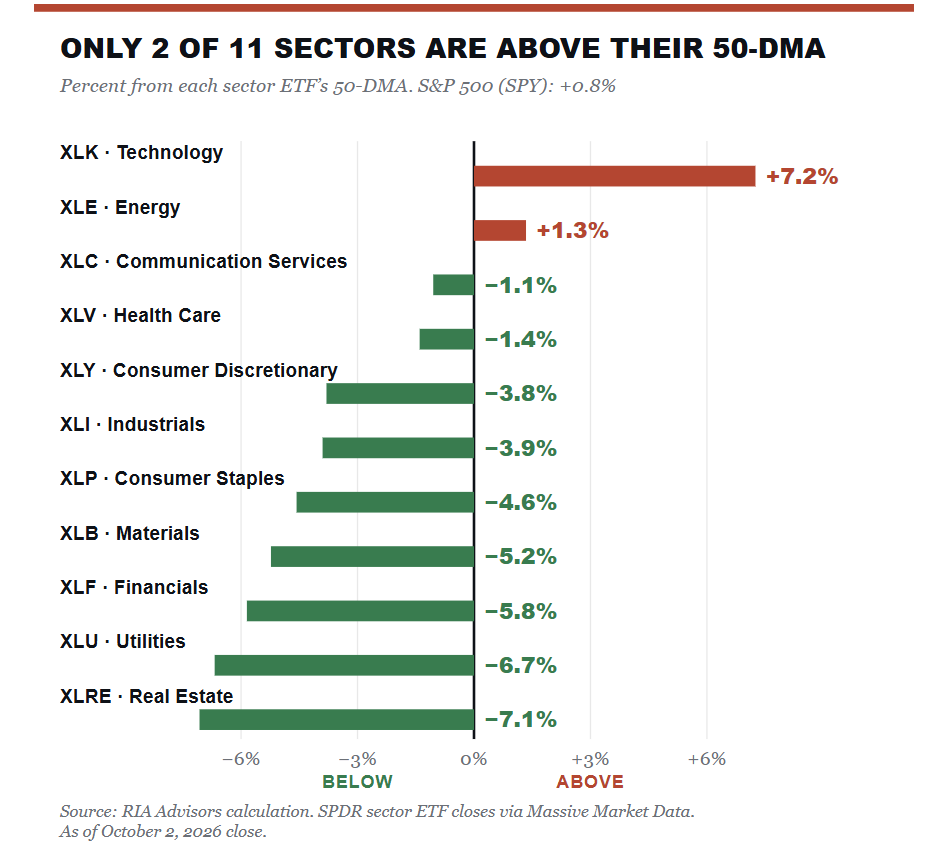
Technology sits 7.2% above its 50-DMA, and energy 1.3% above. The other nine sectors trade below theirs, led by real estate at −7.1%.
Dispersion cuts both ways, though. The skeptics will tell you a market this narrow has to break, and eventually they may be right. However, deeply oversold sectors are exactly where a “broadening” rally would come from. Real estate, utilities, and financials are the groups most hurt by rising yields. They also have the most room to snap back if Friday’s pullback in rates continues. A retreat in the 10-year below 5% would likely do more for market breadth than any earnings report.
This week, patience pays at the top of the range. We continue to recommend trimming positions that have run toward the record and rebalancing back to target weights. Pullbacks that hold the 50-DMA near 7,658 are buyable. A close above 7,800 on strong volume would confirm a breakout and open a path toward 8,000. A close below 7,560 would break the range. That’s where we’d raise hedges and tighten stops, with the 200-DMA near 7,224 as the next support.
The single level to watch next week is 7,800. Clear it, and the summer consolidation resolves higher. Fail there again, and the range is likely to continue, with the risk tilted toward the 7,560 floor.
The Week Ahead
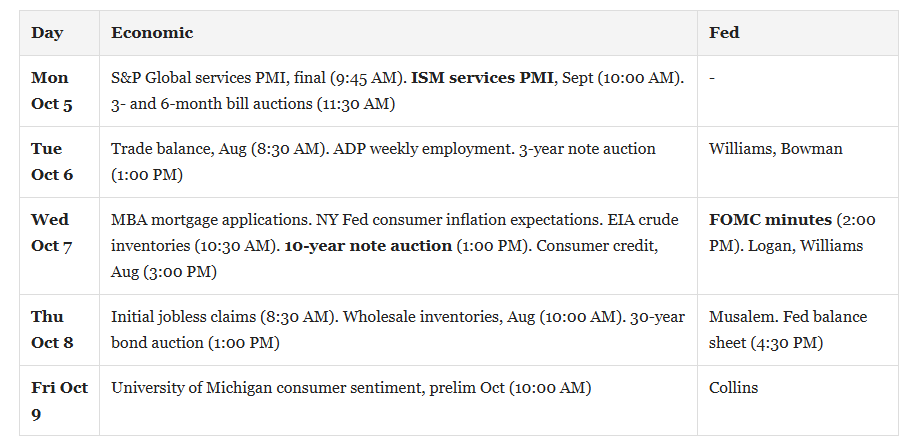
Next week is thin on data, but we will get the September FOMC minutes on Wednesday afternoon to better understand the rationale for the Fed’s rate hike. That meeting produced a 12-0 vote, a hike to 3.75-4.00%, and a dot plot that erased the 2027 cut path entirely. It will be interesting to see how many participants shared Lorie Logan’s view that another 50 basis points or more is needed, and how many leaned toward Christopher Waller, who said last month he would lean toward holding. Since that meeting, Core PCE came in at 3.0% against a 3.4% consensus, and September payrolls were weak, as we discussed above.
Earnings start in earnest next week, with the banks beginning on October 13.
Price Of Happiness: Missing The Things That Matter
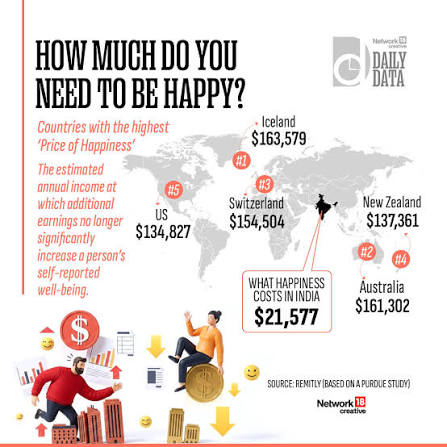
The “price of happiness” chart came around again recently, and the number attached to it was as confident as ever. One widely shared version, built from a Remitly analysis, ranked 50 countries. The measure: how close the average wage gets to the income where happiness supposedly “plateaus.” Slovenia was the only country where wages cleared the bar.
In the U.S., the figure landed at 55.8%, with a “price of happiness” pegged at $134,827, precise to the dollar. The trouble is that the figure doesn’t measure happiness at all, and I can show you that using the exact study the chart is built on.
Tweet of the Day


Comments
Log in or sign up to join the conversation.