

At the close of trading yesterday (8/16/2021) the S&P 500 Index is up 100.22% on a price-only basis from its March 23, 2020 low of 2,237.40. It took the market 353 trading days to reach this feat or just short of a year and a half.
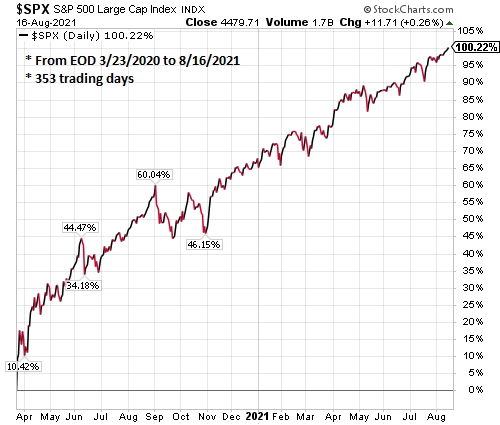
As the chart shows, except for some volatility around the U.S. election in November of last year, the market has been on a steady move higher. This year through August 16, the S&P 500 Index is up 19.27%. Certainly, some consolidation of the returns achieved since the pandemic low last year would be healthy and expected. On the other hand, as noted in my post at the end of July, A Stealth Equity Market Correction, under the surface of the market a correction seems to have occurred.
Comments
Log in or sign up to join the conversation.