


Image Source: Pixabay
Watch the video from the WLGC session on 22 Apr 2025 to find out the following:
- Is the market forming a true bottom or just setting up for another leg down?
- What does low volume really tell us about current supply and demand dynamics?
- Which key price levels should traders watch for a potential bullish reversal?
- How do historical market patterns from 2011 and 2022 compare to today's setup?
- And a lot more…
Market Environment
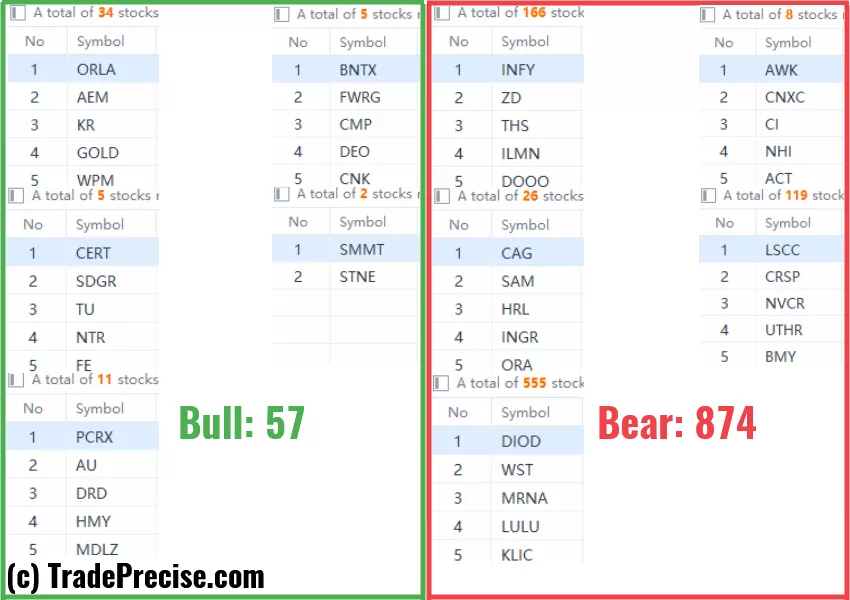
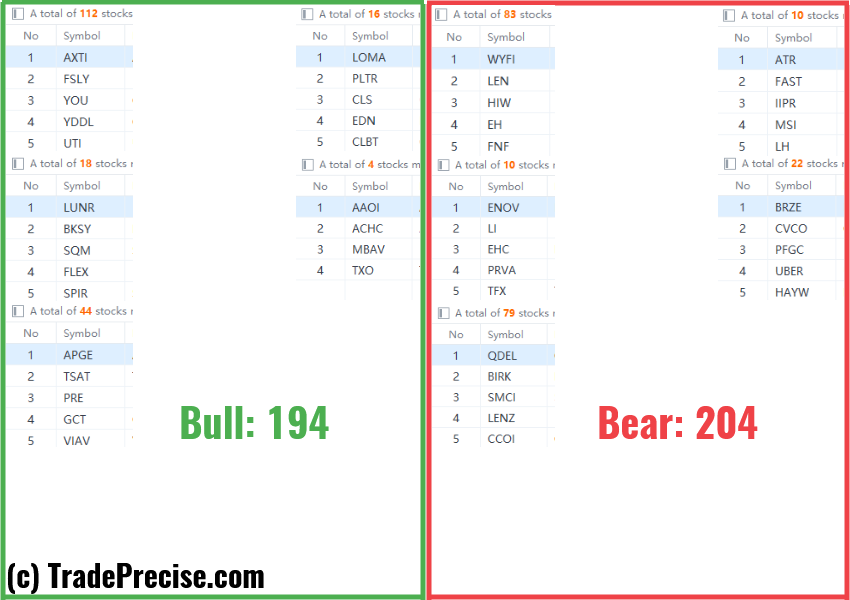
The bullish vs. bearish setup is 57 to 874 from the screenshot of my stock screener below.
(Click on image to enlarge)
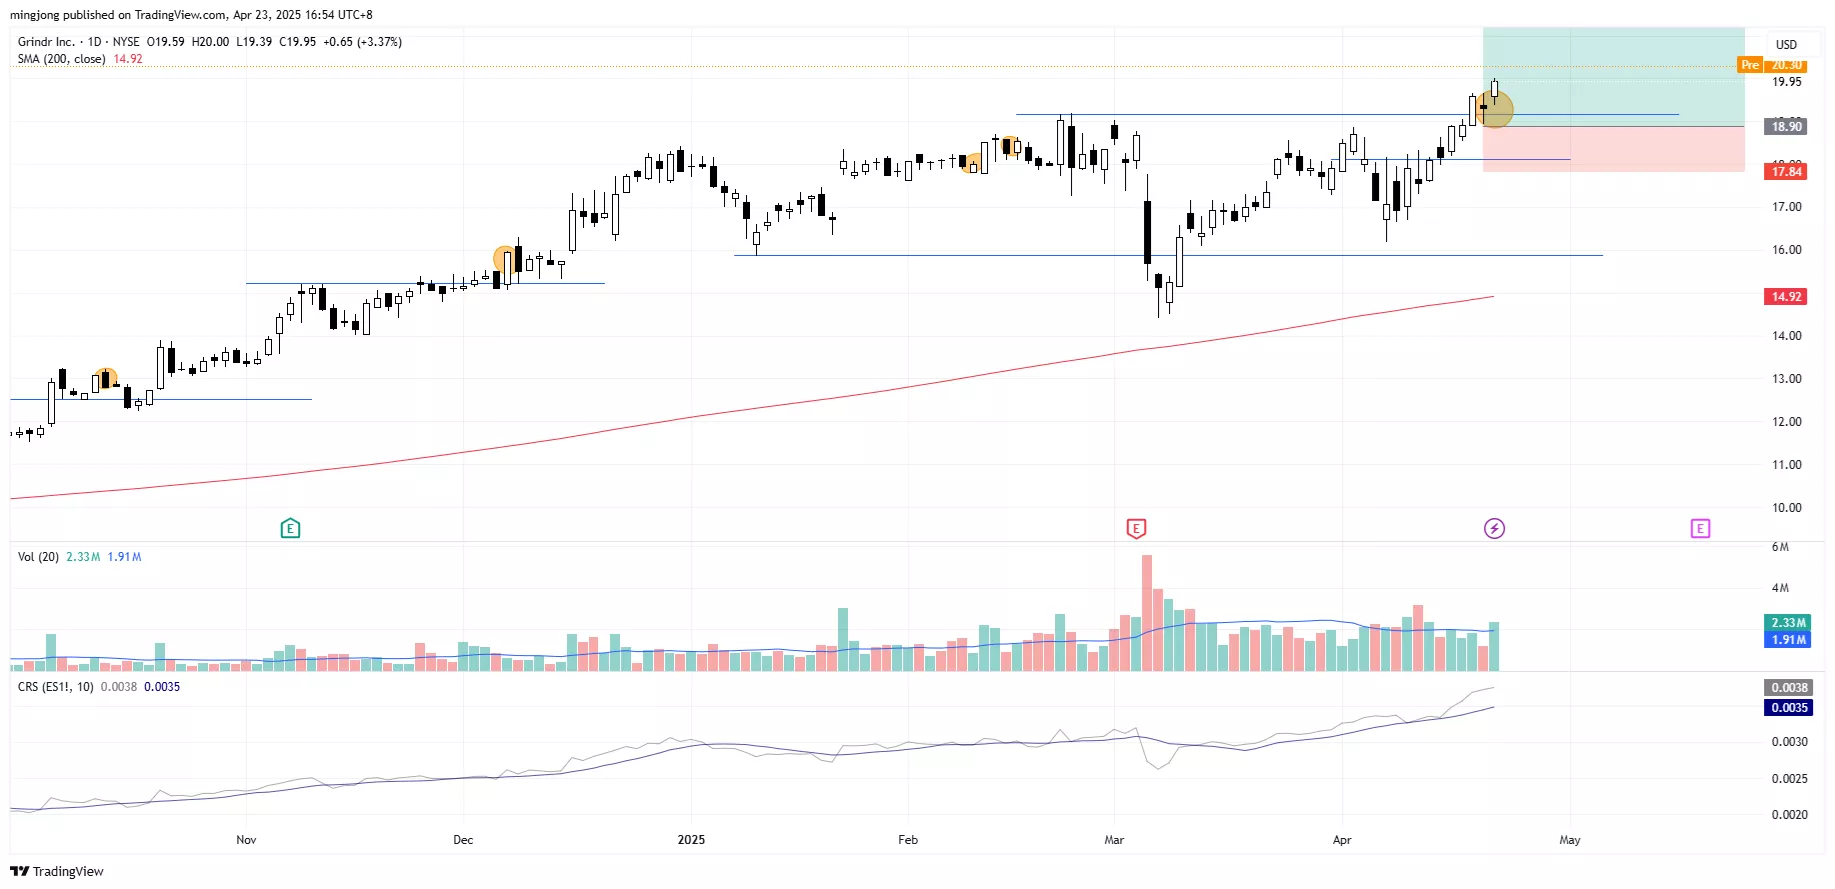
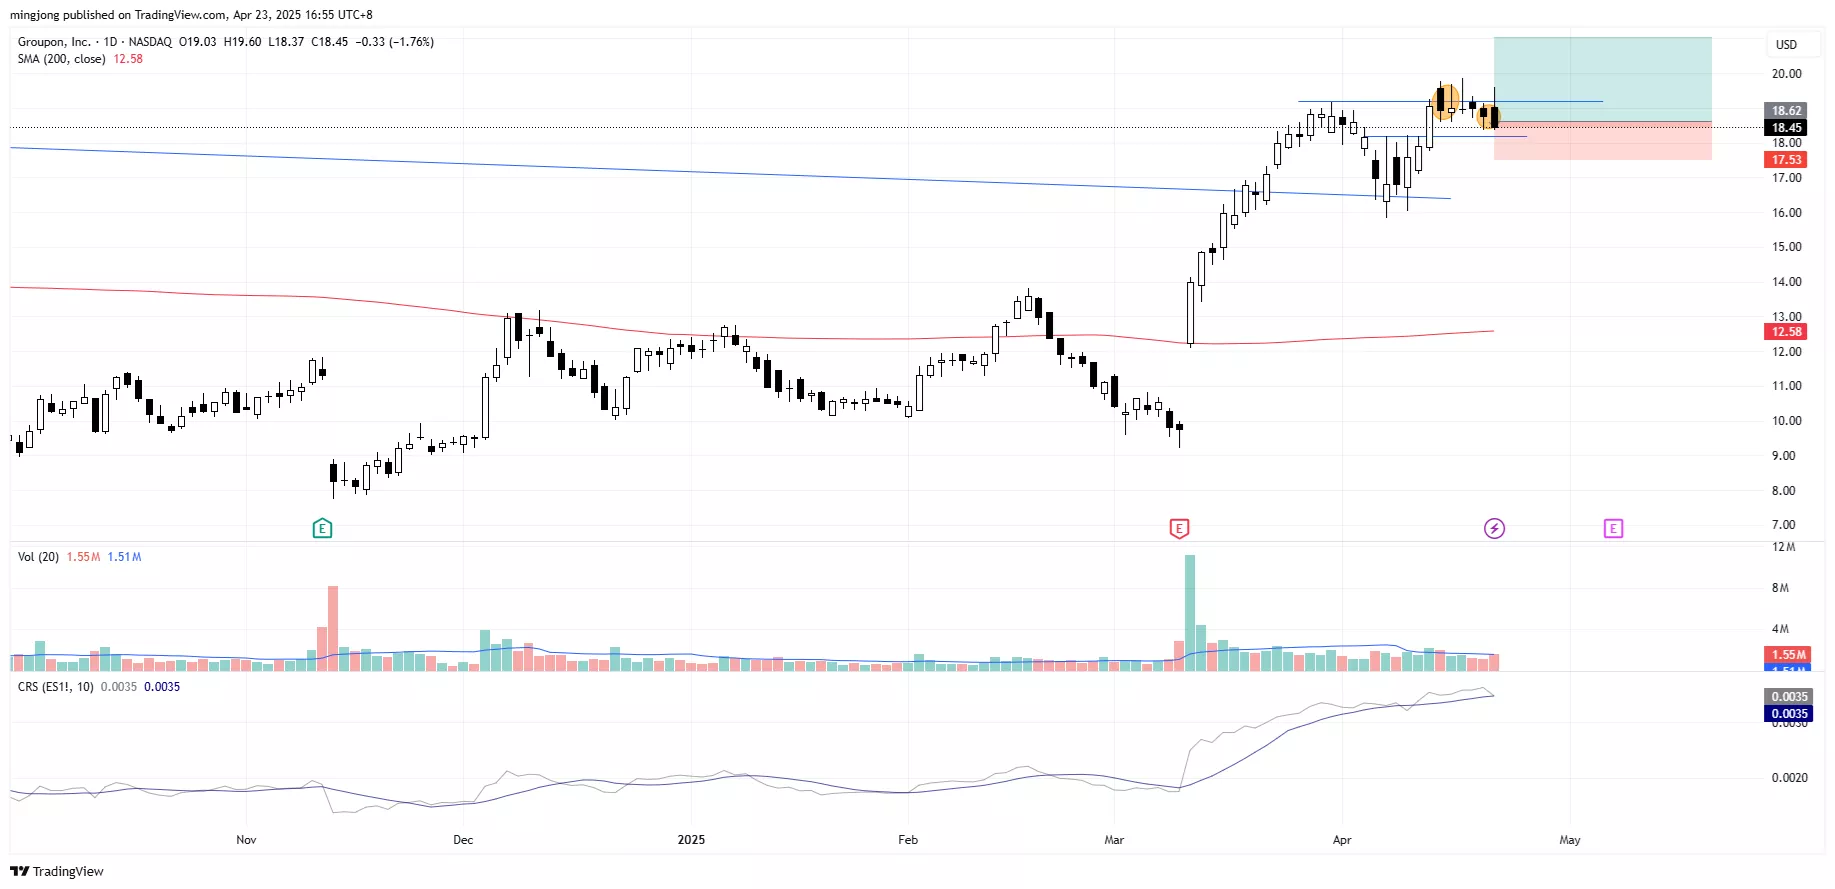
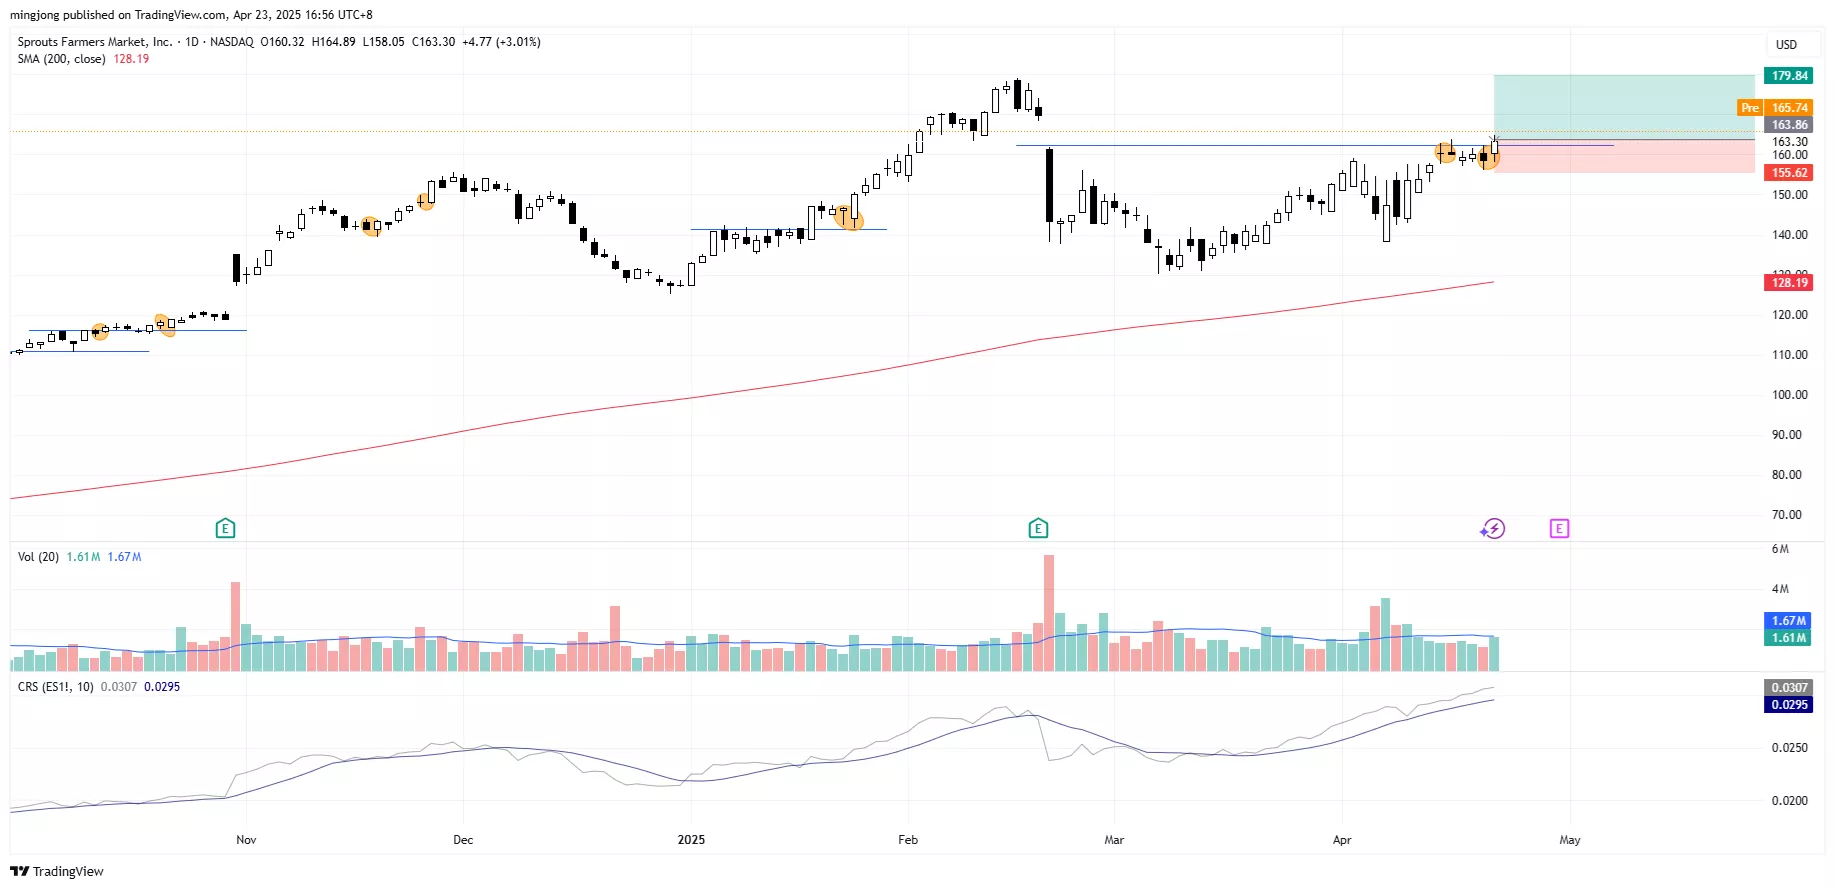
3 Stocks Ready To Soar
9 actionable setups such as were discussed during the live session before the market open (BMO).
(Click on image to enlarge)
(Click on image to enlarge)
(Click on image to enlarge)
More By This Author:
One Signal That Could Tell You When The Bears Return
The Bottoming Process Starts
Weakness Looming In S&P 500: Start Of A Bigger Market Drop?


Comments
Log in or sign up to join the conversation.