
The Bottoming Process Starts

Image Source: Pixabay
Watch the video below to discover the following:
- How the market breadth behaved during these 6 market crashes and how to anticipate a market bottom.
- What traders and investors should do during this extremely volatile period.
- The magic MA line that supports the long-term trend in the past 15 years.
- The bull trap you need to watch out for WHEN the bottoming process is unfolding (price action is the ultimate confirmation).
- And a lot more ...
Video Length: 00:30:05
Market Environment
The bullish vs. bearish setup is 7 to 868 from the screenshot of my stock screener below.
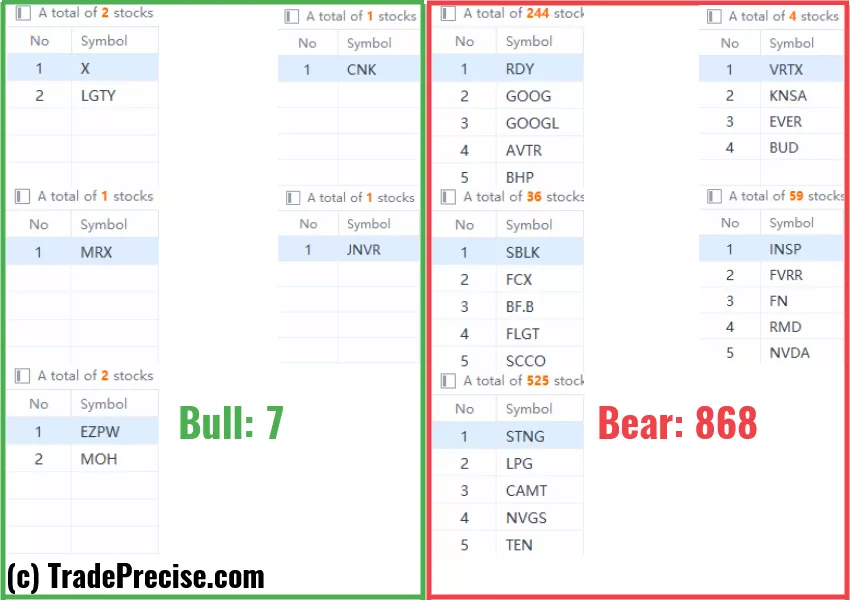
2 Stocks Buck The Trend During Market Crash
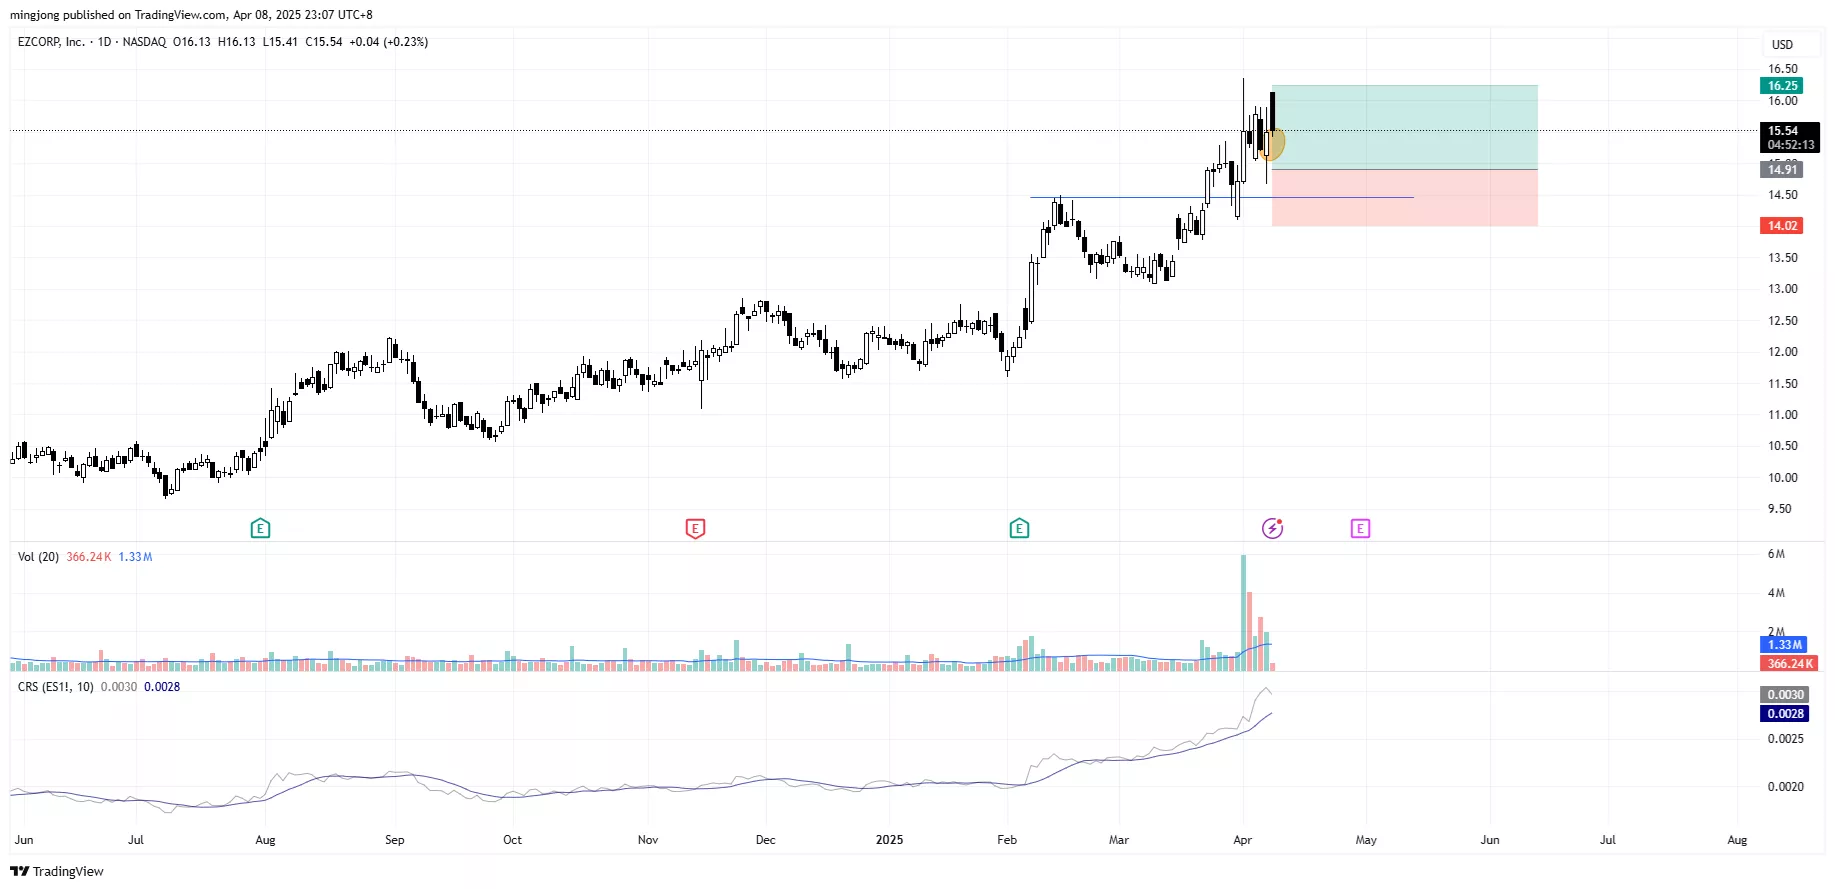
MRX, EZPW were discussed during the live session before the market open (BMO).
(Click on image to enlarge)
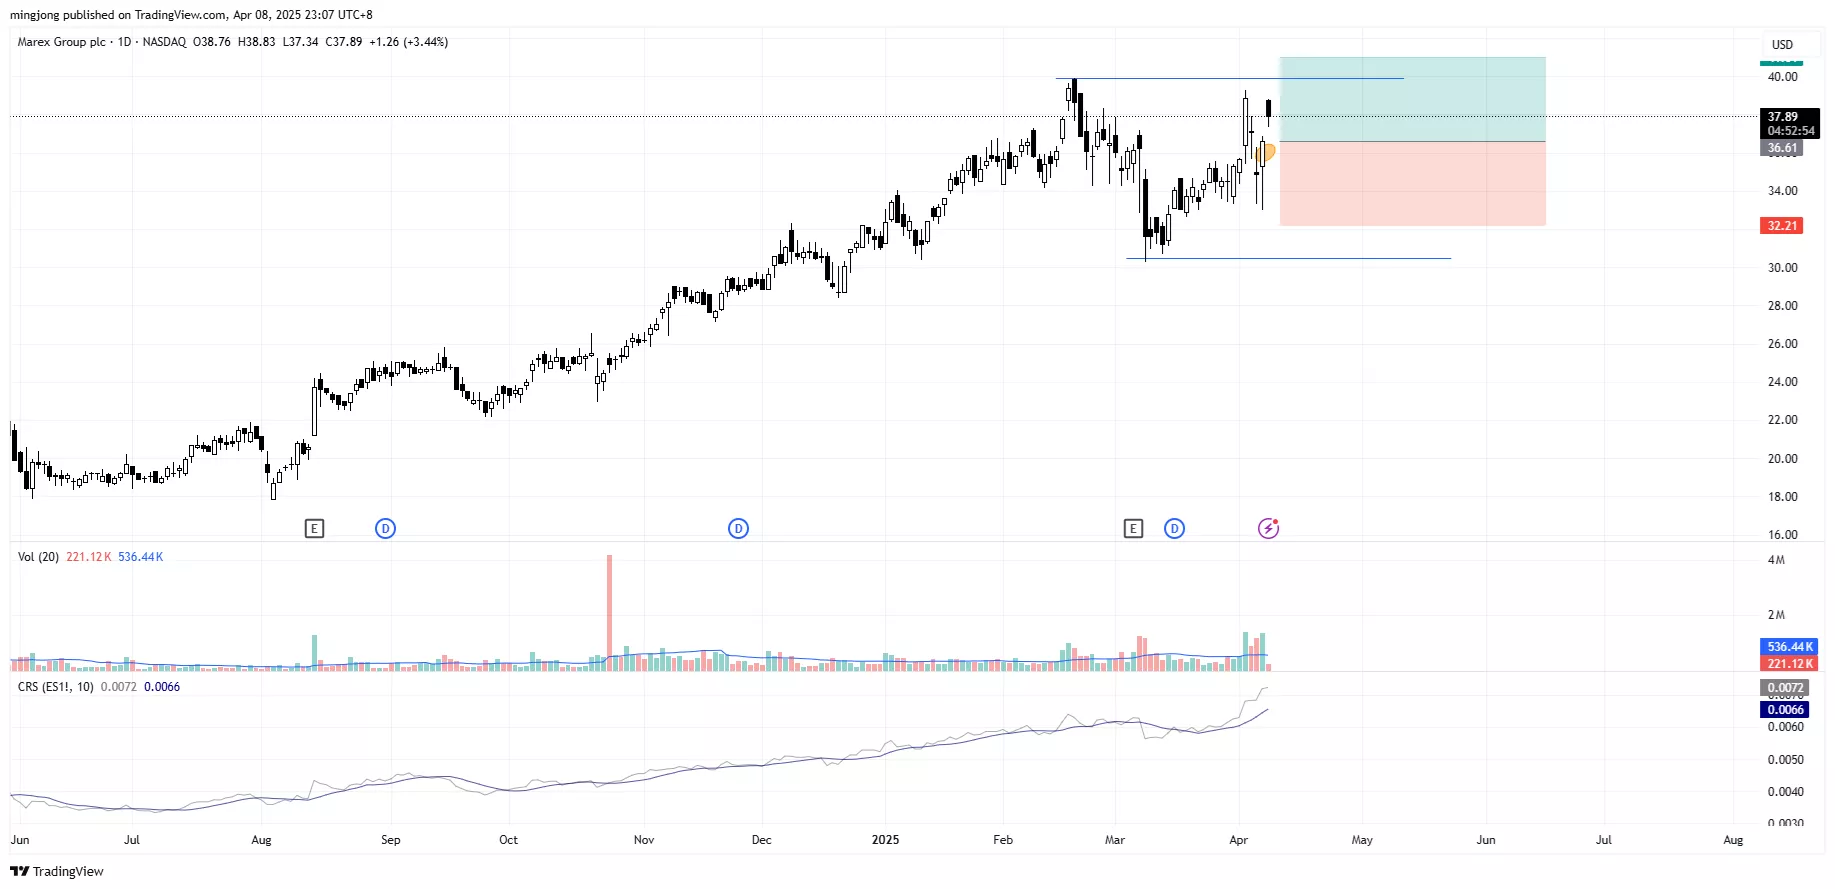
(Click on image to enlarge)
More By This Author:
Weakness Looming In S&P 500: Start Of A Bigger Market Drop?
Rebound Or Fakeout? The 200-Day MA Holds The Key To The Next Big Move
Relief Rally As A Bull Trap? Bottoming Or More Weakness To Come?
Disclaimer: The information in this presentation is solely for educational purpose and should not be taken as investment advice.
How did you like this article? Let us know so we can better customize your reading experience.

Comments
Leave a comment to automatically be entered into
our contest to win a free Echo Show.

