

On a price only basis the S&P 500 Index is up over 91% since the March 23, 2020 low. Nearly halfway through 2021 and the S&P 500 Index is up a strong 14%. One can look at these returns and match them up to the S&P 500 Index's valuation and valuations are elevated. In a low-interest-rate environment though, it is reasonable for stocks to trade at a higher valuation. Additionally, when evaluating investor sentiment and equity fund flows, it does not appear investors are all in on stocks.
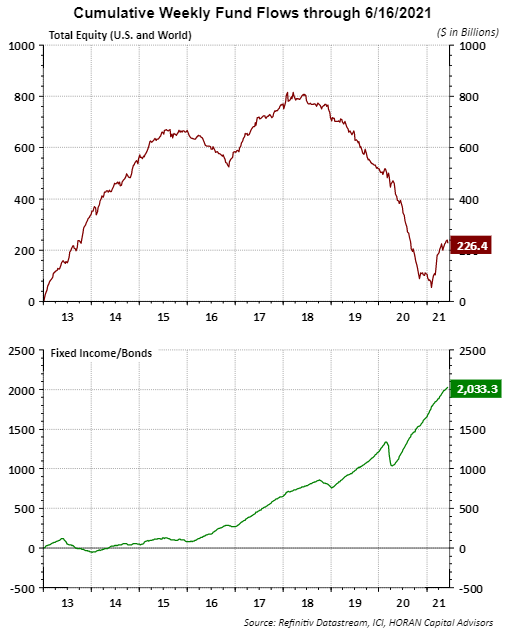
The below chart shows cumulative weekly flows into stocks and bonds. The area that has attracted the most investor interest is bonds, up over $2 trillion since 2013. Cumulative equity flows of $226 billion lags far behind the flows into bond ETFs and mutual funds. The downward trending maroon line since 2018 means investor flows are coming out of stocks.
Image
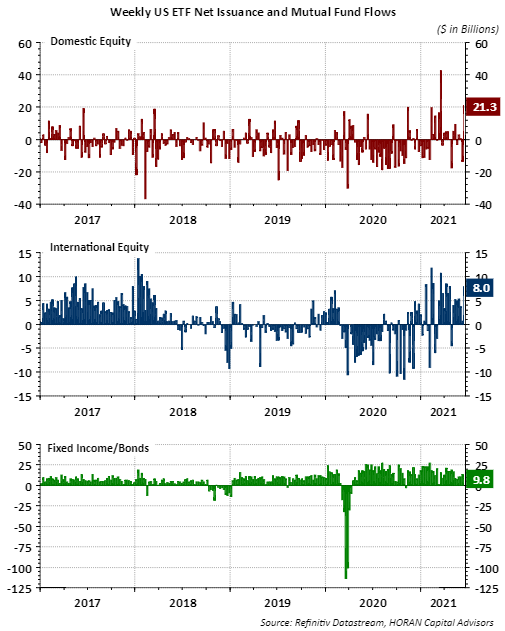
The increase in equity flows in 2017 was supported by strong and consistent flows into international equities. The third panel in the below chart clearly shows that the bond category received the most stable investor inflows since 2017.
Image
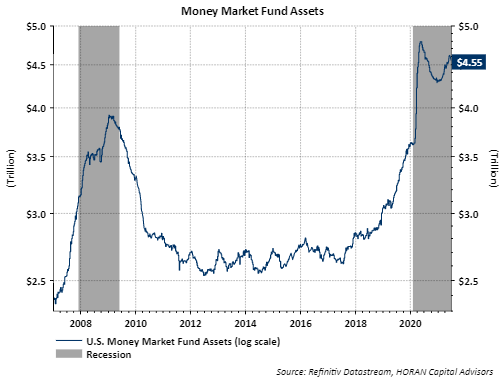
And one last observation on fund flows is displayed in the below chart. Nearly $4.6 trillion resides in money market funds, a staggering amount given the low or no rate of return on those funds in this low-interest-rate environment. Money market assets did decline from June of last year to the end of 2020, but the above chart shows much of the money market outflows went into bond ETFs and bond mutual funds.
Image
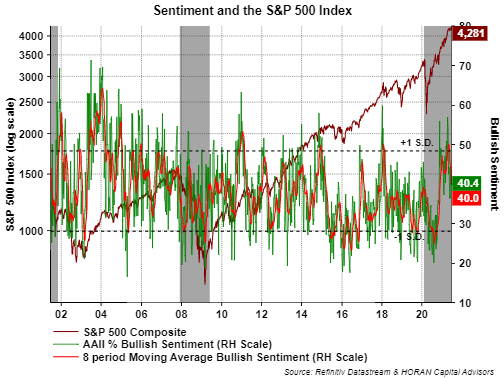
So fund flows certainly represent one view on investor sentiment as it looks at actual investor actions versus a response to a survey. Yet, the surveys also suggest investors are not overly bullish. Last week's report from the American Association of Individual Investors Sentiment Survey showed bullish sentiment declined slightly to 40.4%, which is down from early April's 56.9% level. These sentiment results are most actionable at their extremes and this 40% level is far from an extreme falling in between the extreme bullishness and extreme bearishness levels.
Image
The other sentiment reading worth reviewing is the CNN Business Fear & Greed Index. This index incorporates seven different sentiment measures, such as the VIX reading, market momentum, and the CBOE Put/Call Ratio. The current reading falls just in the fear range at 44. This is not extreme fear, but the index is not at an extreme greed level either.
Image
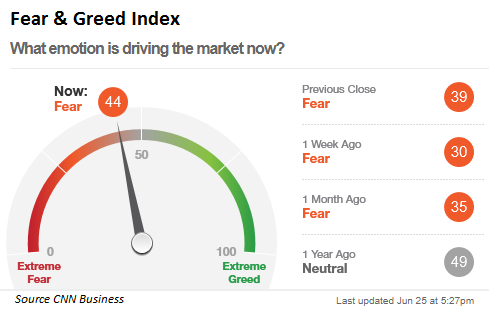
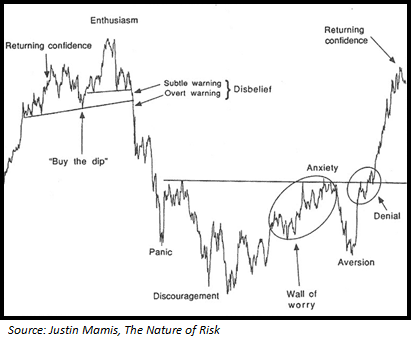
In conclusion, stock valuations are elevated; however, analysts have underestimated earnings growth for companies as the economy exits the pandemic-induced recession. Most S&P 500 companies have reported first-quarter earnings and an astounding 87% reported earnings above analyst estimates versus the long-term average of 65%. So if earnings growth continues to be reported better than expectations, valuations are likely not as elevated as they might appear. Additionally, both investors' actions and sentiment responses do not seem to be indicating excessive exuberance. This seems a perfect "climb a wall of worry" market.


Comments
Log in or sign up to join the conversation.