


Not a whole lot has happened since my last update. Indices are morphing into trading ranges, minimizing the impact of some of the losses, even losses registering higher volume distribution.
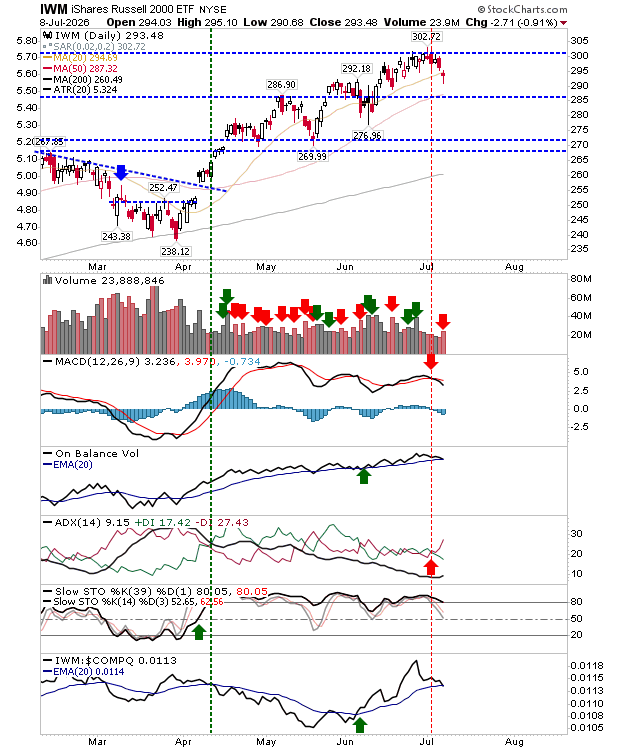
The Russell 2000 (IWM) undercut its 20-day MA on confirmed distribution. Technicals saw new losses in the MACD and +DI/-DI. Next up is the 50-day MA. Such a test will confirm a sequence of higher highs and higher lows - maintaining the rally - or confirming trading range support...
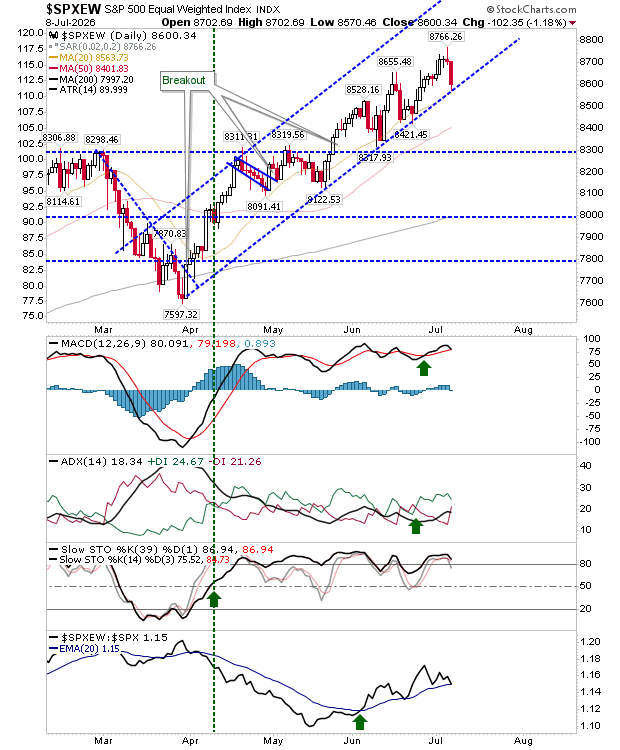
The equal-weighted S&P took over a 1% loss today as it tagged its 20-day MA and trendline support. Technicals remain net positive.
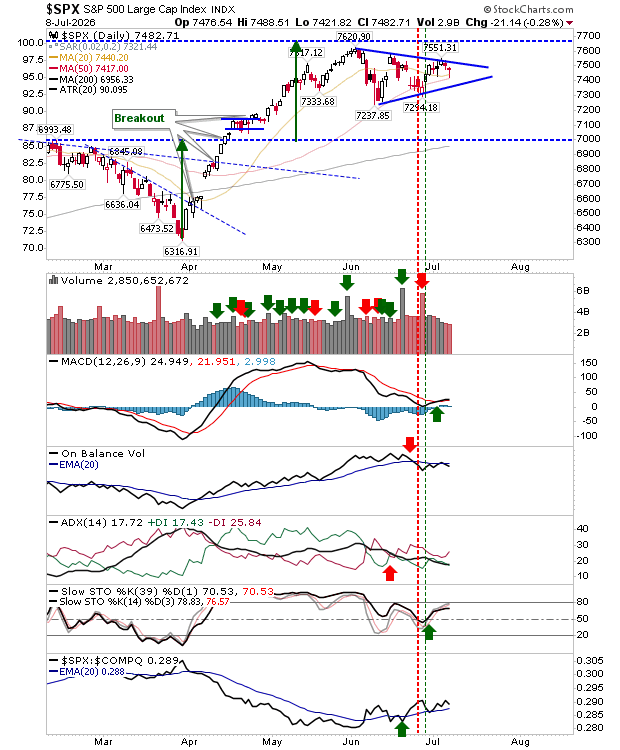
The S&P is trading inside a broader trading range, thats also a bullish symmetrical triangle. Technicals are mixed; bullish MACD and Stochastics offset by bearish On-Balance-Volume and +DI/-DI. The trade is swing trade on break of support/resistance with a stop on the flip side.
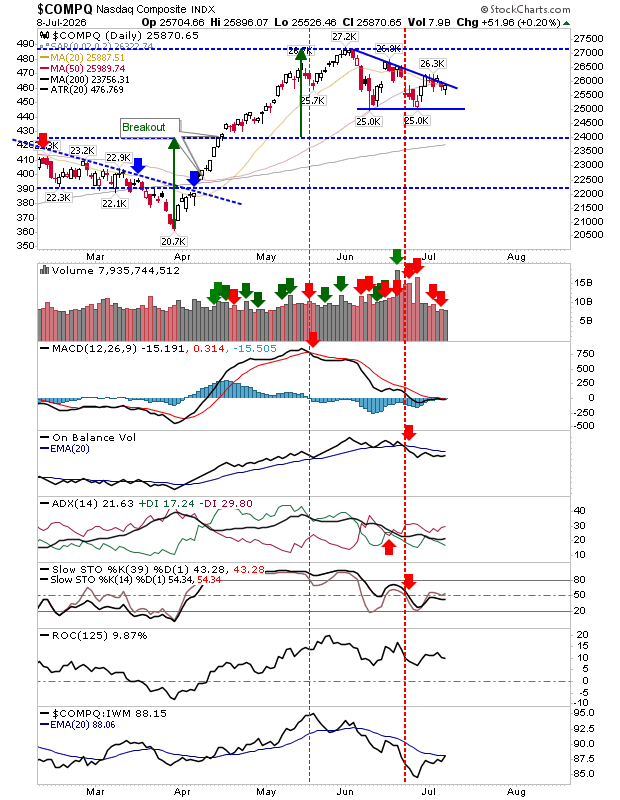
The Nasdaq is also shaping a consolidation within a larger trading range. Here, the consolidation triangle should break in the direction of the trend (higher); if trading this break, a stop goes on a loss of 25K. Technicals are bearish, so the risk for failure of this break is high.
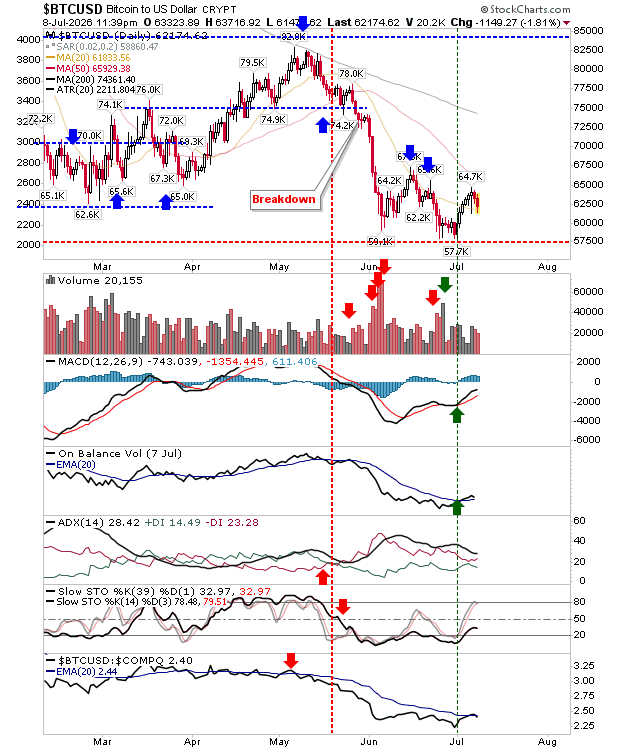
Bitcoin (BTC.X) got a bit of a reprieve after managing a bounce off 57.5K, that for a while, looked like it was going to fail. It followed this with a push above its 20-day MA, but it has since failed to break through 65K and at least challenge the last swing high. This is still the best shorting opportunity, but cover if there a move back to 64.5K.
There are trading opportunities across the different asset classes, but broader trends are still open for debated. Prior action (except in Bitcoin) favors bulls, but let price be your lead.



Comments
Log in or sign up to join the conversation.