


We've had the AI panic sell, and the 'its not so bad' rebound, happen all within the trading ranges set by August lows and September highs - in effect, a whole lot of noise - unless your name is Jensen Huang and you are/were the CEO of Nividia (NVDA). What this means going forward remains to be determined, but outside of Nvidia it's neither bullish nor bearish.
Those who trade the ranges will have managed to bank a nice gain on the short trades generated by the various bull traps across the indices that led to the subsequent sell off, and undercut of prior range support.
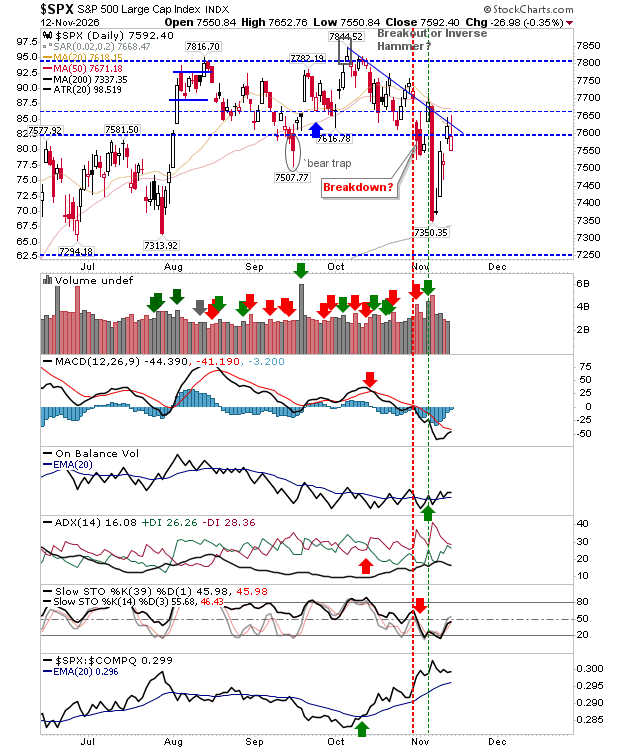
The S&P has returned to declining resistance within its trading range, closing with a spike high through this resistance level, and finishing close to the level that defined swing low support in September. Technicals are mixed, but there is a working return in bullish accumulation for On-Balance-Volume that may be the catalyst for a push back to 7.8K and a challenge on the prior 'bull trap'. It does look the most likely tade from here, particularly as remaining technicals sit on the verge of a return to a net bullish state, and the index is vastly outperforming the Nasdaq in relative terms.
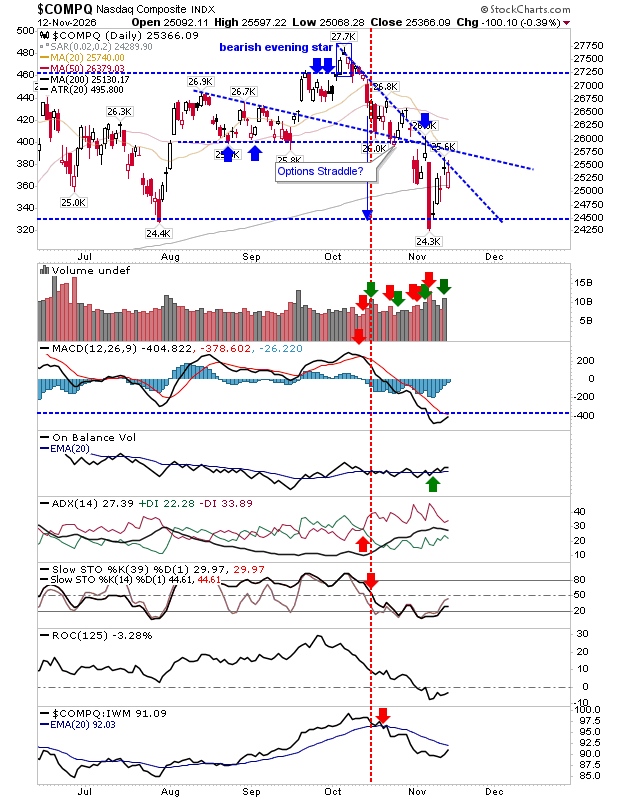
The Nasdaq has similar bearish pressures as the S&P, although they are occurring closer to its 200-day MA and range support, and therefore more susceptible to a breakdown and accelerated selling. The technical picture is also weaker but does have the benefit of a 'buy' trigger in On-Balance-Volume, although momentum is clearly in bearish territory.
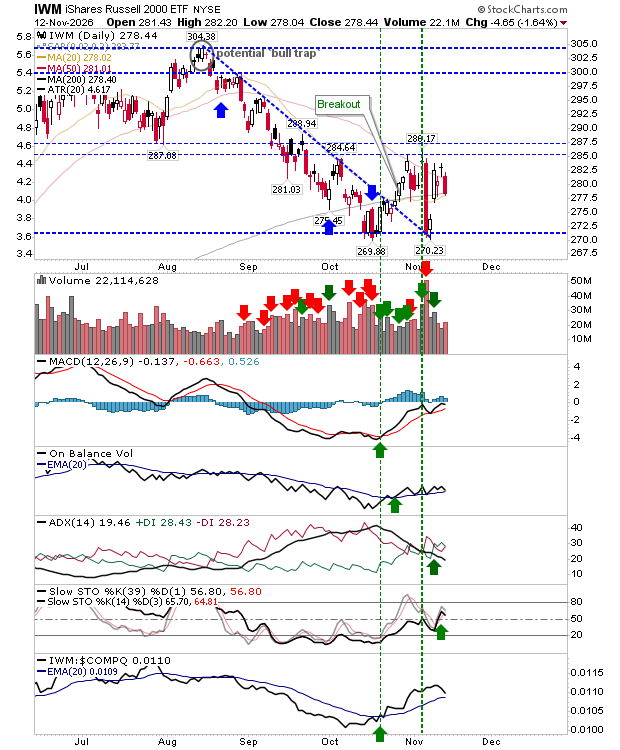
The Russell 2000 (IWM) is caught in a pincer move by its 50-day and 200-day MA. The index had sold off steadily since its August 'bull trap', but the October bounce looked to have merit until AI poked its head in. The good news is that technicals remain net bullish and panic selling can only occur in an oversold state. A spike below $275 might still be a good place for GTC 'buy' orders, but a loss of $270 would mean greater concerns.
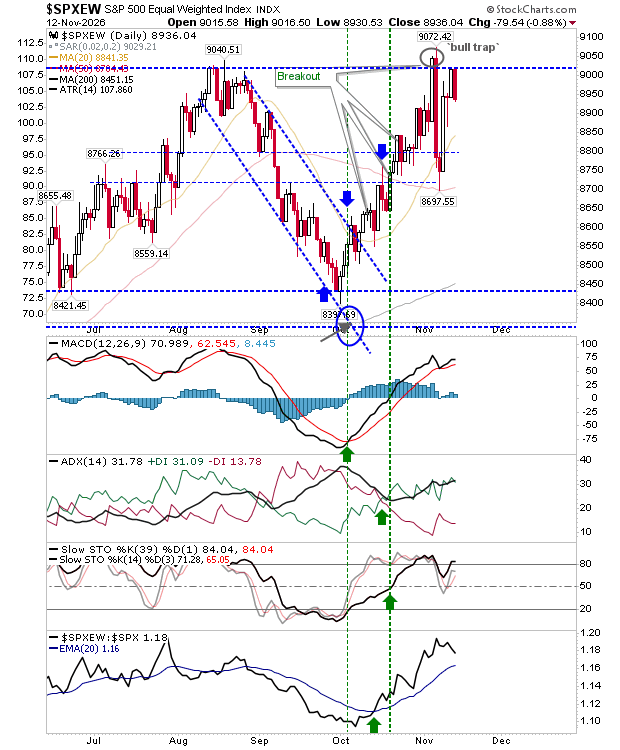
The equal-weighted S&P (SPXEW) had managed to rally all the way back to challenge the 'bull trap', just easing back on the test, but is well placed to post a solid breakout. Technicals are firmly bullish. This index may be the true guide, and not the AI sector.
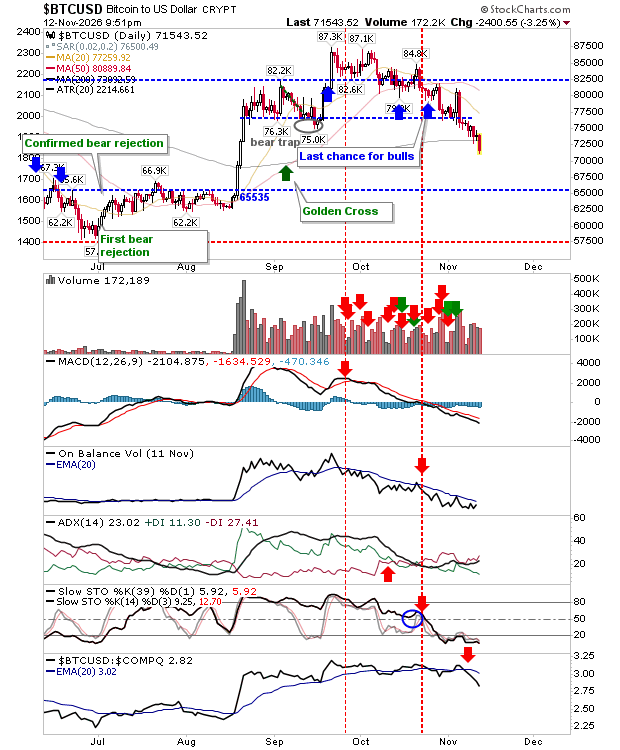
The one asset that I have got wrong is Bitcoin (BTC.X). The cryptocurrency has utterly failed since the reversal from its 20-day MA. The 200-day MA was unable to provide support, and the base-building exercise I had hoped for is back on hold. It's still a long-term acquisition, it's just doesn't look like it will be completing this base anytime soon. The next trade opportunity might come on a test of 65K, should it occur.
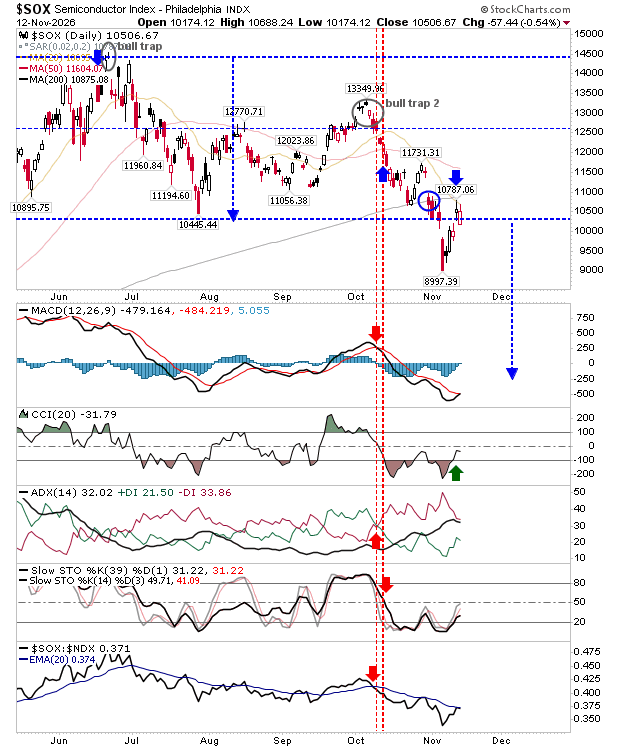
For the rest of the week, bulls should watch the equal-weighted S&P for an upside break, bears can track the Nasdaq for a bearish break. If you want an active short, the Semiconductor Index (SOX) failing at its 20-day MA, just above 10K and July swing low support, looks a good bet with a sizable measured move on offer as a target.



Comments
Log in or sign up to join the conversation.