


Another day of selling swept the market which left many indices trading below their 200-day MAs. This is good for long term investors as it resets the pullback count which will create the next big buying opportunity. On the downside, it's all painful to watch.
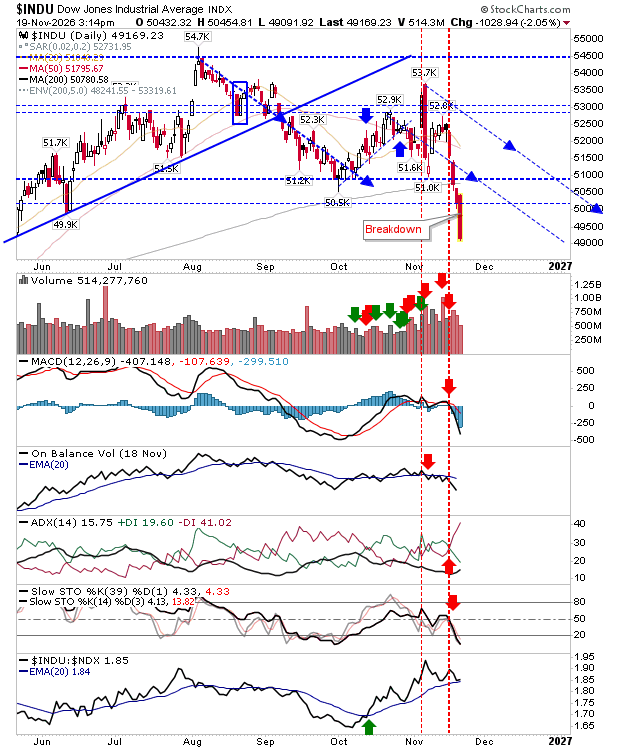
The Dow Industrial Average had been performing well, at least until today. There was a clear slice of the June swing low, and loss of 50K support, with technicals now net negative. I had market two measured move targets; the first was cleanly sliced, the second has almost been reached. The worry is that this is just the start of the selling. For better (or worse), trading volume was light.
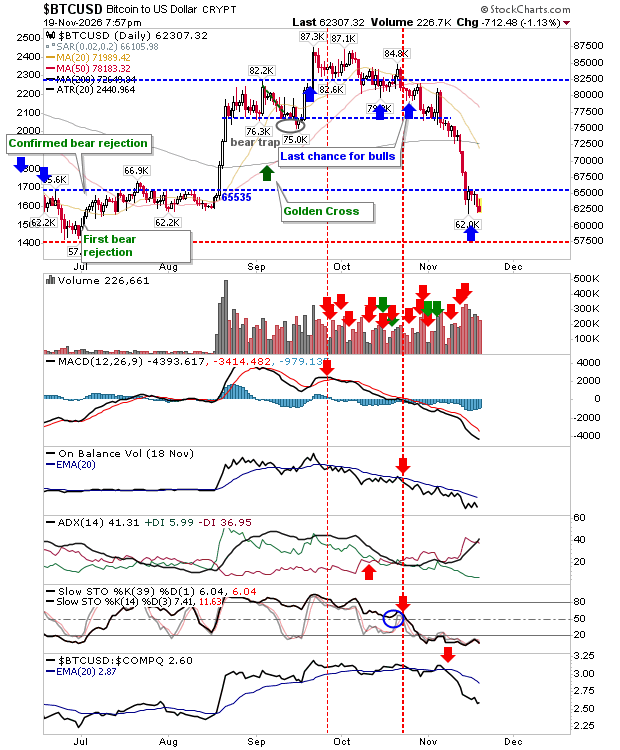
The bigger surprise was the damage done in Bitcoin (BTC.X). This was an asset that originally sold hard into the July low, before it found some demand. But now it finds itself struggling to hold current support. Last week's spike low (from the bullish hammer) is set to be negated as a reversal candlestick, but there is an aggressive buy with a very tight stop (loss of $62K) as I have seen recoveries from similar situations in the past. But this is crash territory and there isn't a whole lot of support below $57.5K
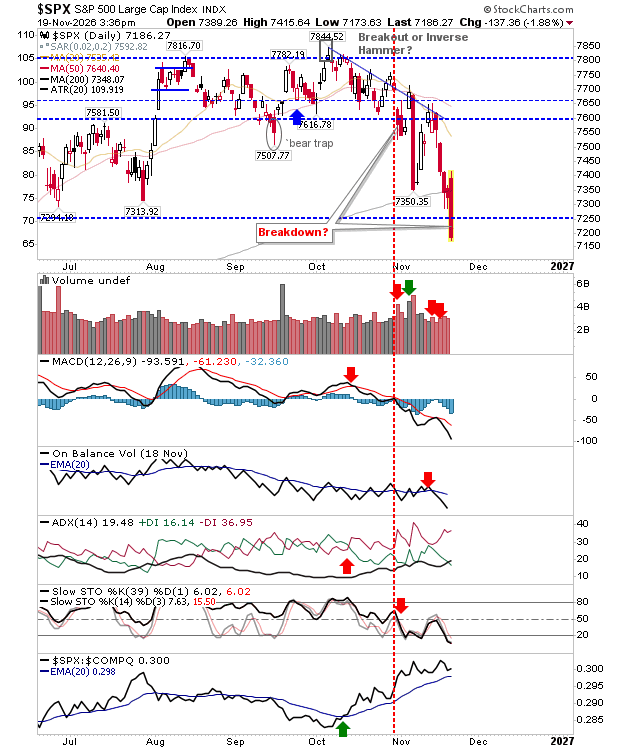
The S&P loss 7,250 support as part of the 200-day MA undercut. Technicals are net negative and oversold. There is still a chance for a 'bear' trap, but as other indices move away from support it becomes harder to see this leading a recovery, but that shouldn't discount the possibility; a move above 7.25K would confirm a 'bear trap'.
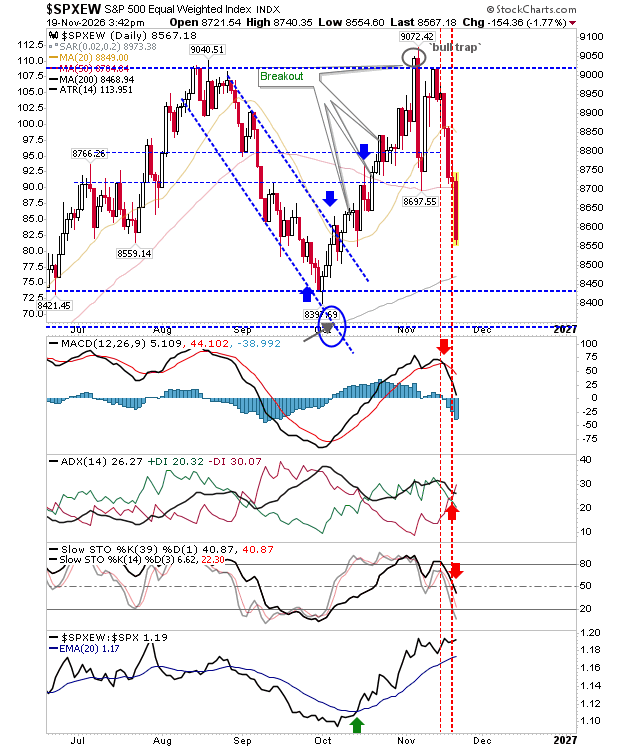
It's not all doom-and-gloom. The equal-weighted S&P took a big hit, but it's still range bound, so losses remain noise within the larger trading range. Technicals are net negative but it hasn't yet challenged its 200-day MA or range support, so if the index can hold on it may yet take on a leadership role on the next recovery.
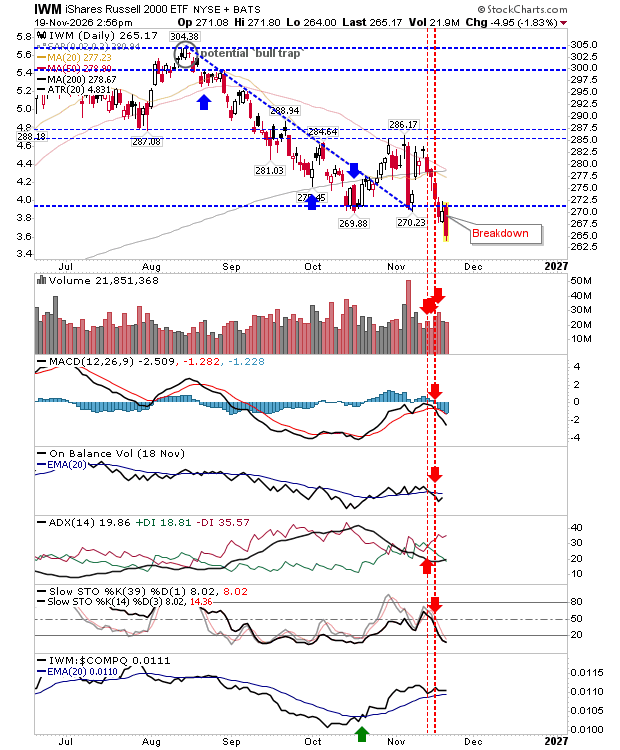
The Russell 2000 (IWM) finally gave up October swing low support. Remember, triple tops or bottoms are rare, so if an asset touches a support or resistance level for a third time then the chance for a break is high. Technicals are net bearish and oversold, so this is crash territory. As an added point, watch for a bearish 'Death Cross' between 50-day and 200-day MA which extends the decline to something more long term.
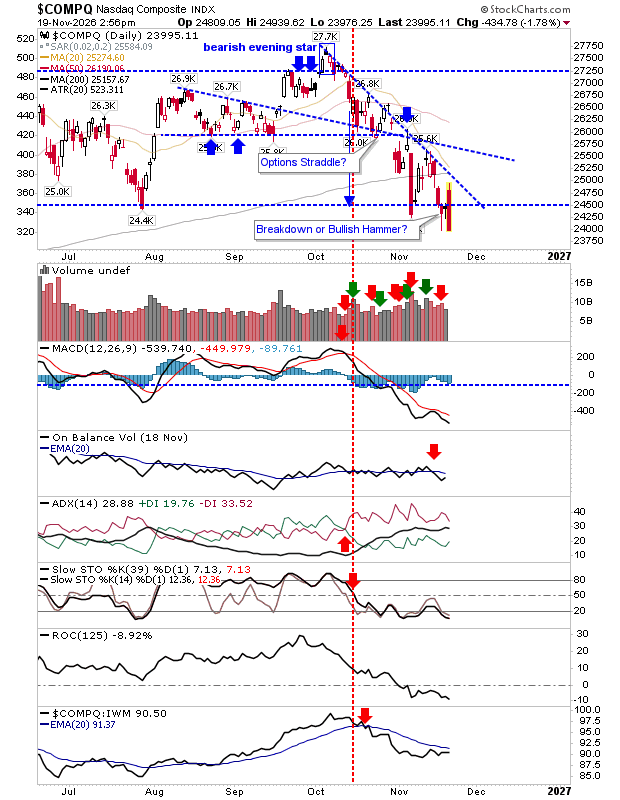
The Nasdaq, like Bitcoin, closed with a bearish engulfing pattern that has challenged the spike low from the bullish hammer earlier this week. Technicals are net bearish and primed for a crash.
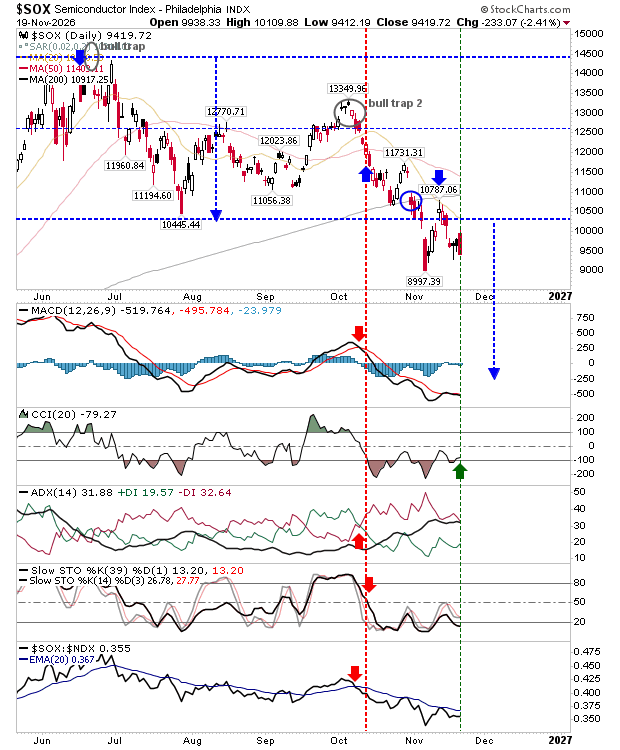
Ironically, Semiconductors (SOX) had a relatively quiet day. Today marked a bearish engulfing pattern, but as this an index in an oversold state there is no additional bearish weight to this pattern; it's a reversal pattern, not a continuation one.
With losses of 200-day MAs the indices are no longer at a quick bounce, so now it's a best case for a sideways move rather than further losses. Personally, I would like to see a buying opportunity similar to what we saw in April 2025 as I have money to put to work...



Comments
Log in or sign up to join the conversation.