

The S&P 500 index has been under pressure over recent months, and political uncertainty is the main driver behind such weakness. The trade war with China has been a major problem for the market in 2019, and House Speaker Nancy Pelosi announced a formal impeachment inquiry into President Trump this week, which is providing another big source of political uncertainty.
In this context, investors are naturally wondering what kind of impact all this political uncertainty will have on stocks.
However, this is actually the wrong question. Trying to manage your portfolio by reading the headlines and trying to assess political risk can do more harm than good to your investments.
As opposed to that, implementing trend-following strategies based on hard data and supported by statistical evidence is a much sounder approach to portfolio risk management in all kinds of environments.
Don't Mix Politics And Investing
If you take a look at the historical data regarding the S&P 500 and president impeachments, we have only two observations from past decades, and they provide conflicting evidence.
- When Nixon was impeached in 1973 the market declined 33.4% over the next 12 months.
- When Clinton was impeached in 1998 the market rose 39.2% over the next 12 months.
(Click on image to enlarge)
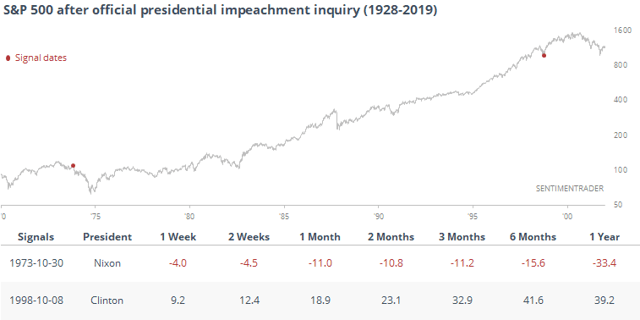
Source: Sentiment Trader
In other words, the size of the sample is ridiculously small, and the two data points are pointing in opposite directions. Importantly, you also need to consider a wide variety of economic and fundamental factors that were affecting the markets when those impeachments took place. It's important to keep on mind that political events do not happen in a vacuum.
However, the main point is that you can't just make simplistic assumptions about how political events will affect the stock market because market behavior can many times be very different from what would be reasonably expected.
The stock market does not like political uncertainty, but how the market behaves in a particular period depends on a wide variety of factors, many of them completely unpredictable.
This chart from Helene Meister at The Street shows what happened to the stock market when Kennedy was assassinated. Talk about political uncertainty and turbulent times. It can hardly get much worse than that.
However, the market performed quite well through all that period. Within a week, the market already had recovered all its losses. Even more important, President Lyndon Johnson asked Congress for a tax cut in January of 1964, and this triggered a massive rally in stocks over the ensuing months.
(Click on image to enlarge)
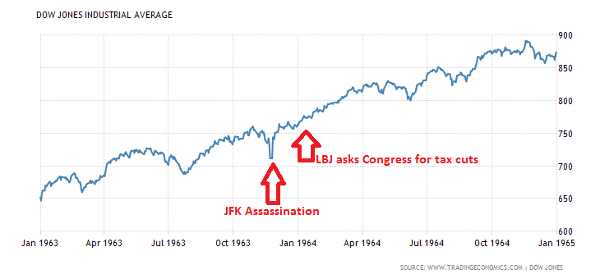
Source: TheStreet.com
If you are looking for more recent evidence, on March 6, 2009, the Wall Street Journal published an article entitled Obama's Radicalism Is Killing the Dow. As it turns out, this was a spectacular buying opportunity in retrospect.
(Click on image to enlarge)
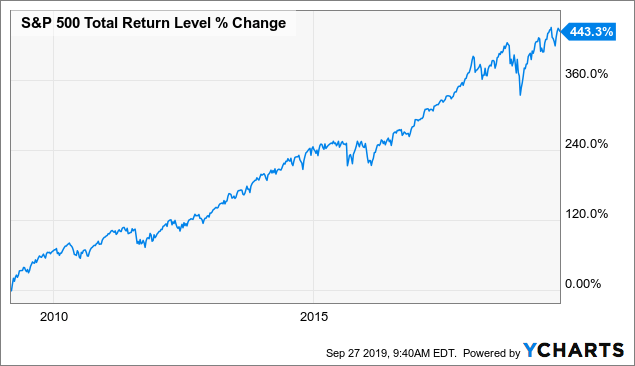
Data by YCharts
During the night when Trump won the election in 2016, the stock market futures were plunging, since this was a surprising result to a good degree. That same night The New York Times published the following paragraphs by Paul Krugman:
It really does now look like President Donald J. Trump, and markets are plunging. When might we expect them to recover?
Frankly, I find it hard to care much, even though this is my specialty. The disaster for America and the world has so many aspects that the economic ramifications are way down my list of things to fear.
Still, I guess people want an answer: If the question is when markets will recover, a first-pass answer is never.
The S&P 500 actually made a quick recovery, and it continued rising in the days after the election, and well into the following months.
(Click on image to enlarge)
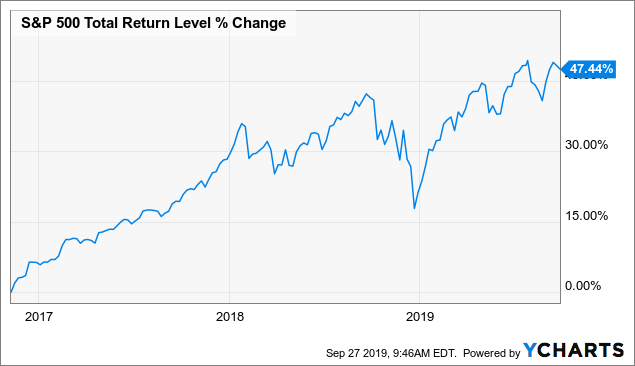
Data by YCharts
I am not saying that economic policy or geopolitical events do not impact markets, those factors do have an influence. However, the evidence shows that you just can't extrapolate the news into future market returns in a simplistic way. The relationship between the S&P and political news is far more unpredictable and intricate than it seems to be at first sight.
How To Protect Your Portfolio In A Bear Market
As opposed to trying to find out what the market will do next, it makes much more sense to build a solid plan for portfolio protection when the bear market comes. The keyword here is "when" the bear market comes, not "if," because bear markets are a necessary evil, and we are going to have to face one sooner or later.
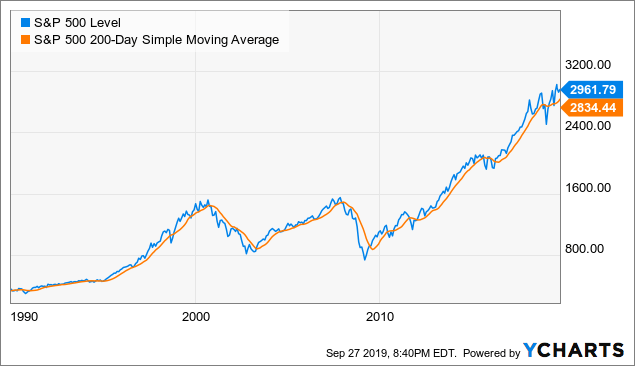
A simple and effective way to protect the portfolio based on a trend following approach is using the 200-day moving average as a trend indicator for the market. The chart below shows the evolution of the S&P 500 index and the 200-day moving average over the long term.
(Click on image to enlarge)
Data by YCharts
There have been some false signals, but the trend indicator has done a solid job in terms of capturing the big bull and bear markets in the S&P 500 over the decades. The main idea is protecting the portfolio when the trend is down, meaning when the S&P 500 is below the 200-day moving average.
A simple approach for protection would be selling stocks and raising cash, but hedging could actually be more efficient when done well, and options can be another interesting vehicle for portfolio protection.
Based on the statistical evidence, this strategy can do a solid job in terms of providing portfolio protection. Its effectiveness has been proven not only in the S&P 500 but also in international stocks and in other asset classes.
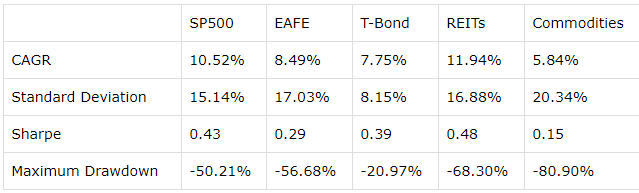
The table below is from a research article from Alpha Architect entitled Trust The Process. We begin with the historical returns and risk metrics for the S&P 500, international stocks (EAFE), T-bonds, REITs, and commodities from 1973 to 2017.
(Click on image to enlarge)
Data Source: Trust The Process, by Jack Voguel
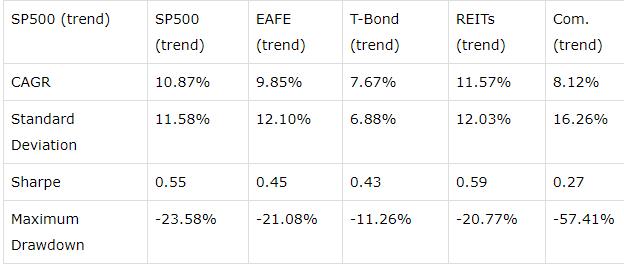
Now, we can take a look at the risk and return statistics for these asset classes when applying a trend following strategy to them.
(Click on image to enlarge)
Data Source: Trust The Process, by Jack Voguel
The main takeaway is quite clear - trend following strategies can increase returns in many cases, and they do a great job in terms of reducing downside risk across all the asset classes examined.
The maximum drawdown - meaning maximum capital loss from the peak - is 50.2% for buy and hold investors in the S&P 500 and a much smaller 23.58% for the trend following strategy over the same period. In other asset classes, trend following can be even more effective at reducing drawdowns.
The main advantage from trend following is that the strategy sells early in a deep bear market and then it buys when prices start to recover. This can avoid the most damaging bear markets.
In the words of Paul Tudor Jones:
The whole trick to investing is: ‘How do I keep from losing everything?’ If you use the 200-day moving average rule, then you get out. You play defense, and you get out."
Trend following strategies have proven to be remarkably effective at improving risk-adjusted performance and reducing risks over long periods of time, meaning multiple decades. However, trend following also can significantly underperform vs. buy and hold over several years in a row. When markets are moving sideways and trends in the market are short-lived, trend following strategies can underperform vs. buy and hold by a wide margin.
The Bottom Line
Trying to predict how political uncertainty will affect the S&P 500 is futile. The relationship between the stock market and politics is much trickier than it seems to be, and market returns depend on a wide variety of factors, many of them related to investor sentiment as well as politics, economics, and finance.
The smart approach is not trying to predict the market, but rather having a plan for portfolio protection in all kinds of environments. Relying on hard data and time-proven strategies with a solid track record of performance is a far sounder method to protect your capital through the ups and downs in the markets.



Comments
Log in or sign up to join the conversation.