

The trends in housing all remain down: starts, permits, completions, and sales.
August 2026 New Residential Construction
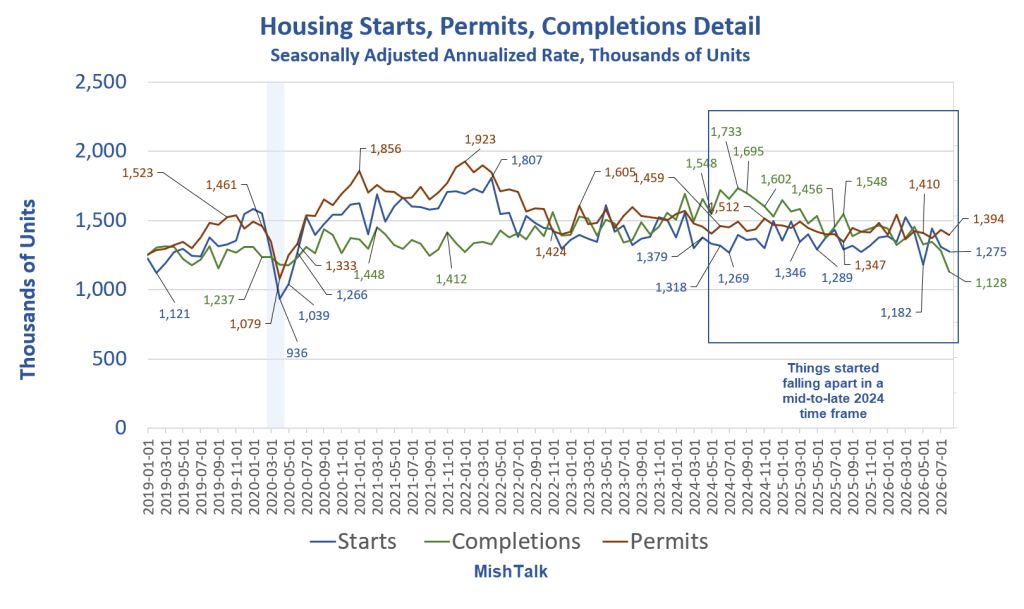
The monthly New Residential Construction report for august 2026 shows a decline in starts, permits, and completions.
Housing Starts
Privately-owned housing starts in August were at a seasonally adjusted annual rate of 1,275,000.
This is 2.6 percent (±12.0 percent) below the revised July estimate of 1,309,000 and is 1.2 percent (±10.8 percent) below the August 2025 rate of 1,291,000.
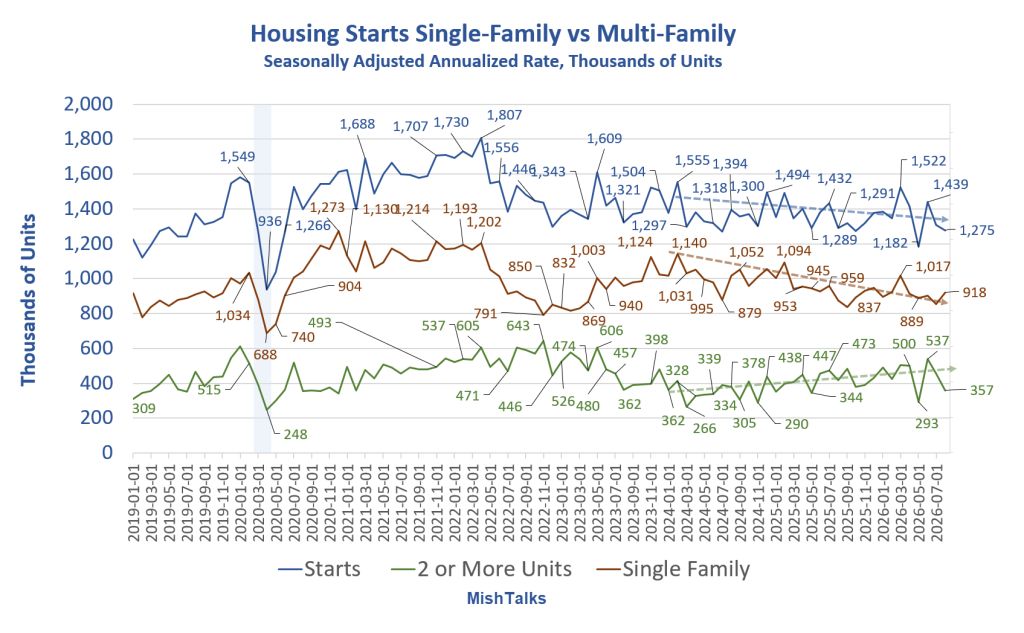
Single-family housing starts in August were at a rate of 918,000; this is 7.6 percent (±14.0 percent) above the revised July figure of 853,000. The August rate for units in buildings with five units or more was 344,000.
Building Permits
Privately-owned housing units authorized by building permits in August were at a seasonally adjusted annual rate of 1,394,000.
This is 2.7 percent below the revised July rate of 1,433,000, but is 3.5 percent above the August 2025 rate of 1,347,000.
Single-family authorizations in August were at a rate of 878,000; this is 1.8 percent below the revised July figure of 894,000. Authorizations of units in buildings with five units or more were at a rate of 467,000 in August.
Housing Completions
Privately-owned housing completions in August were at a seasonally adjusted annual rate of 1,128,000.
This is 11.9 percent (±9.7 percent) below the revised July estimate of 1,280,000 and is 27.1 percent (±8.9 percent) below the August 2025 rate of 1,548,000.
Single-family housing completions in August were at a rate of 816,000; this is 10.4 percent (±9.3 percent) below the revised July rate of 911,000. The August rate for units in buildings with five units or more was 302,000.
Note the margins of error on single-family housing starts ±14.0 percent.
Single Family vs Multi-Family
Single Family vs Multi-Family Details SA in Thousands
Total: 1,275
Single Family: 918
Multi-Family: 357
Housing Permits
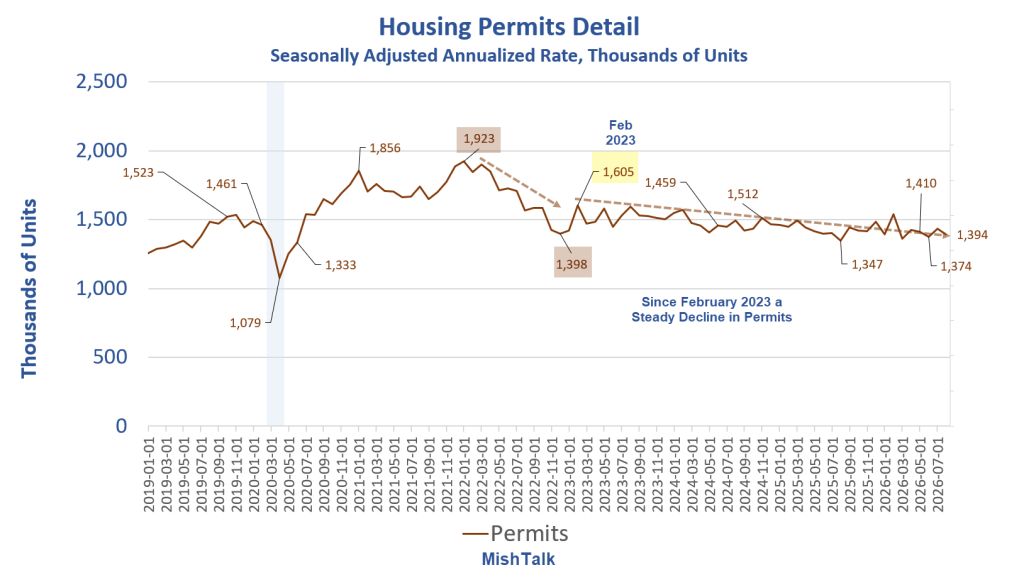
The Covid permit rebound was sharp, in two phases, culminating at 1.923 million in January 2021.
That was followed by a slump to 1.398 million permits in December of 2022.
Since February of 2023, it’s been a slow grind lower.
You cannot start what isn’t permitted.
Housing Completions
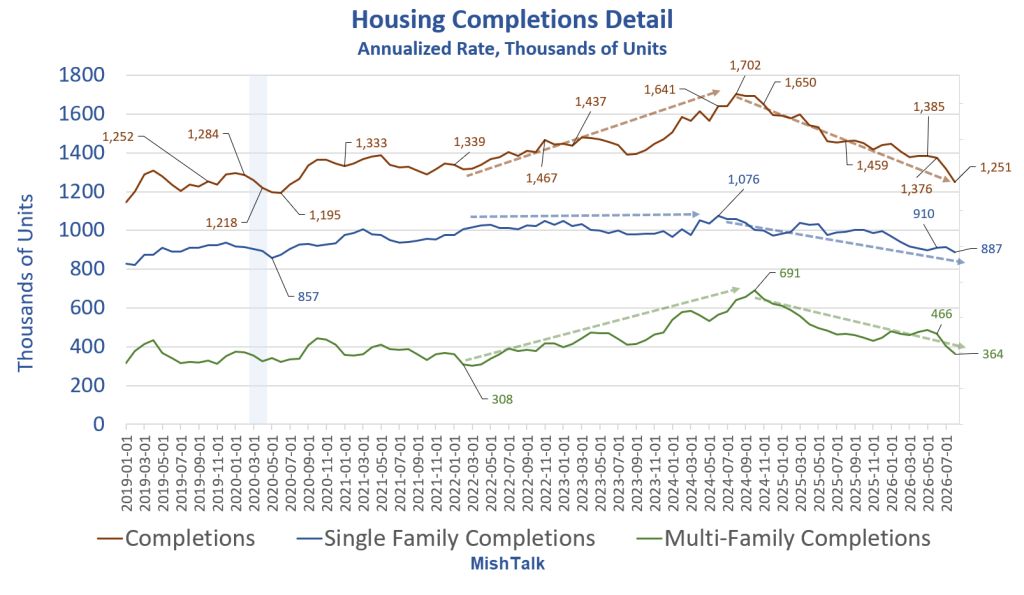
The wave of completions surged 1.7 million units in August of 2024.
Conventional wisdom was the surge in completions would lead to falling home prices and falling rent.
Neither happened.
In isolation, rising completions should pressure rent prices and falling completions support prices.
Deportations and trends toward moving back home with parents make things difficult to project.
Housing Units Under Construction
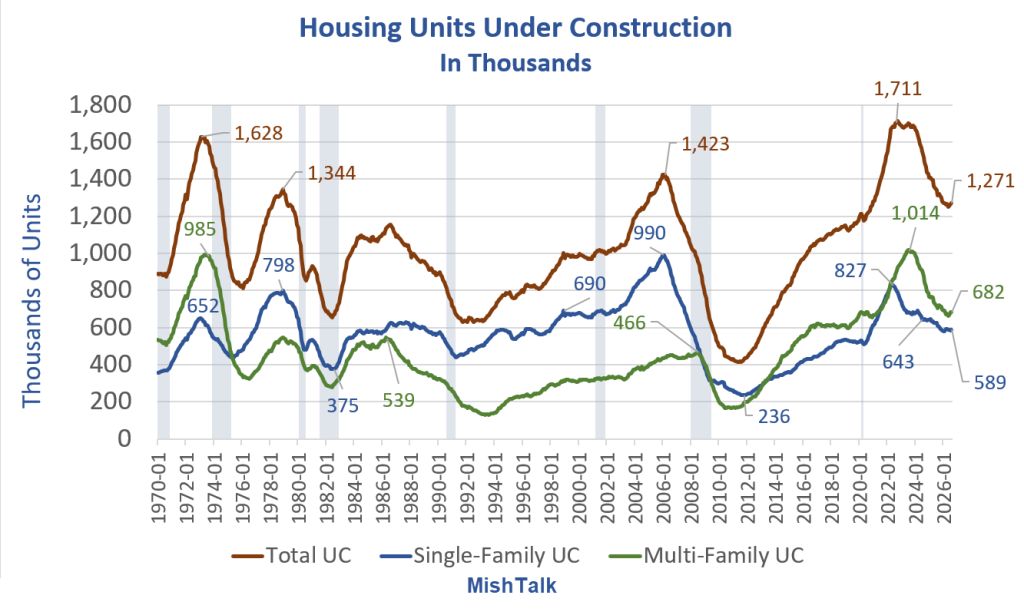
Units Under Construction Details
Total: 1,271
Multi-Family: 682
Single-Family: 589
Despite the big decline, there is still a large number of units under construction. But who can afford to buy?
On the surface, this will put price pressure on units as they complete. But many of these are pre-sold, I believe to buyers who will regret buying.
And people have been predicting a huge price collapse in homes and rents on the basis of completed supply. Neither happened despite the surge in completed homes.
Mortgage Rates
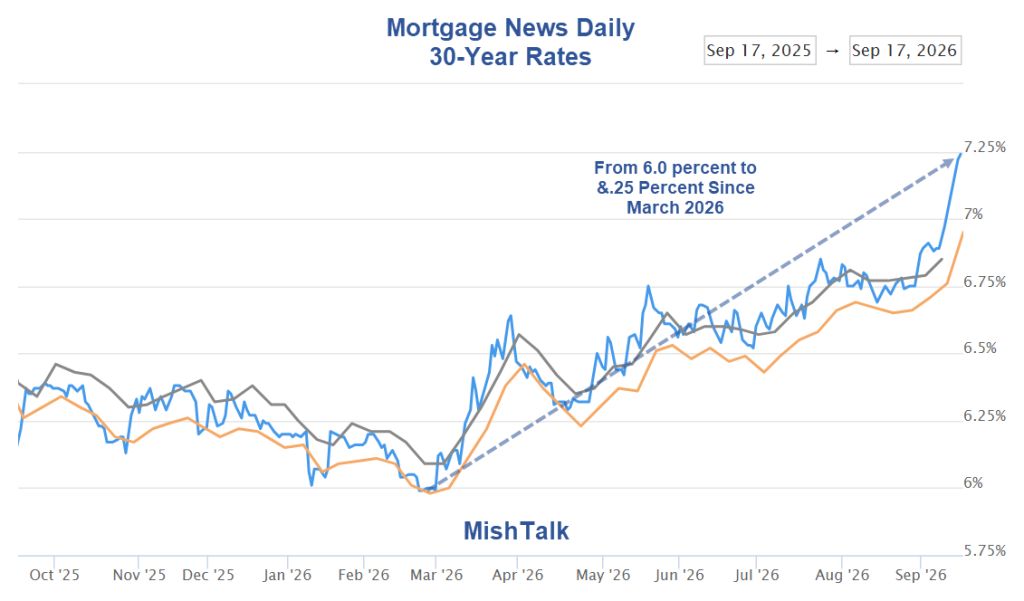
The average 30-year mortgage rate is 7.24 percent, up from 5.99 percent in February according to Mortgage News Daily.
Related Posts
January 30, 2026: Dear Zoomers, Trump Says He “Wants to Drive Up Housing Prices”
Somehow, I doubt Gen Z will like this message.
September 13, 2026: Existing-Home Sales Drop Two Percent, Gone Nowhere for Four Years
It’s more nowhere for now, but a big caution ahead.
September 15, 2026: 10-Year Treasury Yield Highest Since July 2007, 30-Year Since July 2004
That’s the highest in 19 years and 22 years respectively.


Comments
Log in or sign up to join the conversation.