
Honeywell International Inc., Elliott Wave Technical Analysis
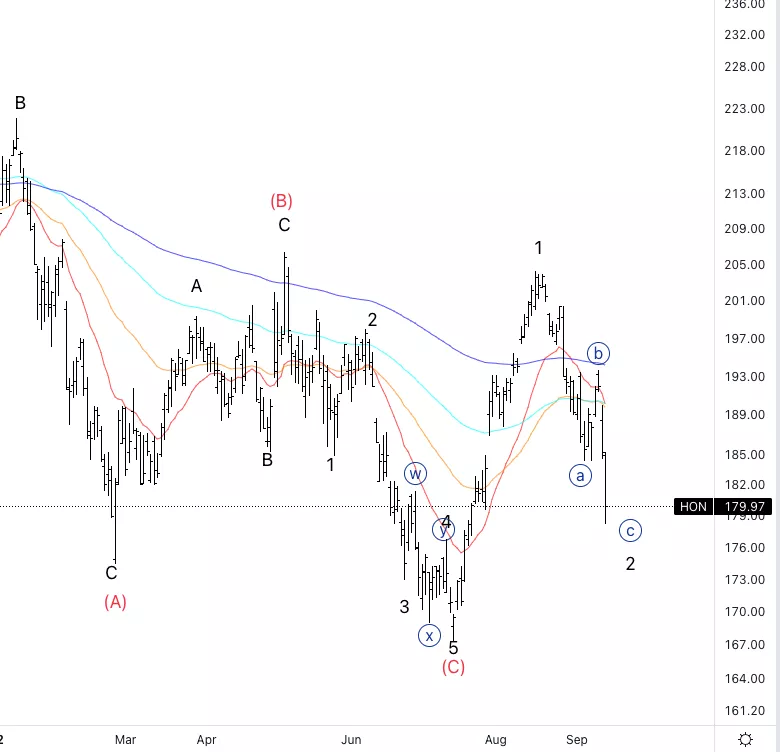
Honeywell International Inc., (HON:NASDAQ): Daily Chart, September 15 2022,
HONStock Market Analysis:Looking for a three wave pullback to be nearly completed.
HON Elliott Wave count: {c} of 2.
HONTrading Strategy:Wait for wave {i} of 3 to have further upside confirmation.
HONTechnical Indicators:We are below all averages, but the RSI is getting into the oversold area.
TradingLounge Analyst: Alessio Barretta
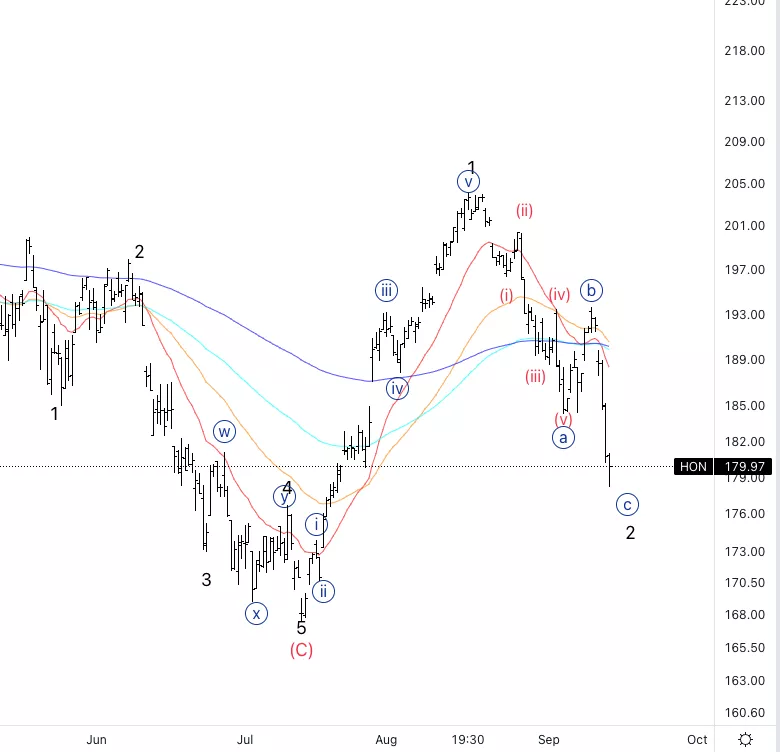
Honeywell International Inc.,HON: 4-hour Chart, September 15 2022
Honeywell International Inc.,Elliott Wave Technical Analysis
HON Stock Market Analysis: Looking for wave {c} to be nearly completed.
HONElliott Wave count: (v) of {c}.
HON Technical Indicators: We are below all averages but we are starting to form bullish divergence on the RSI.
HONTrading Strategy: Looking for upside resumption first.
More By This Author:
Elliott Wave Analysis: Good Bye Bitcoin
Elliott Wave Technical Analysis, Sept. 14: AAVE Token
Elliott Wave Technical Analysis, Sept.14: Pepsico Inc.


Comments
Log in or sign up to join the conversation.