
Pepsico Inc., Elliott Wave Technical Analysis
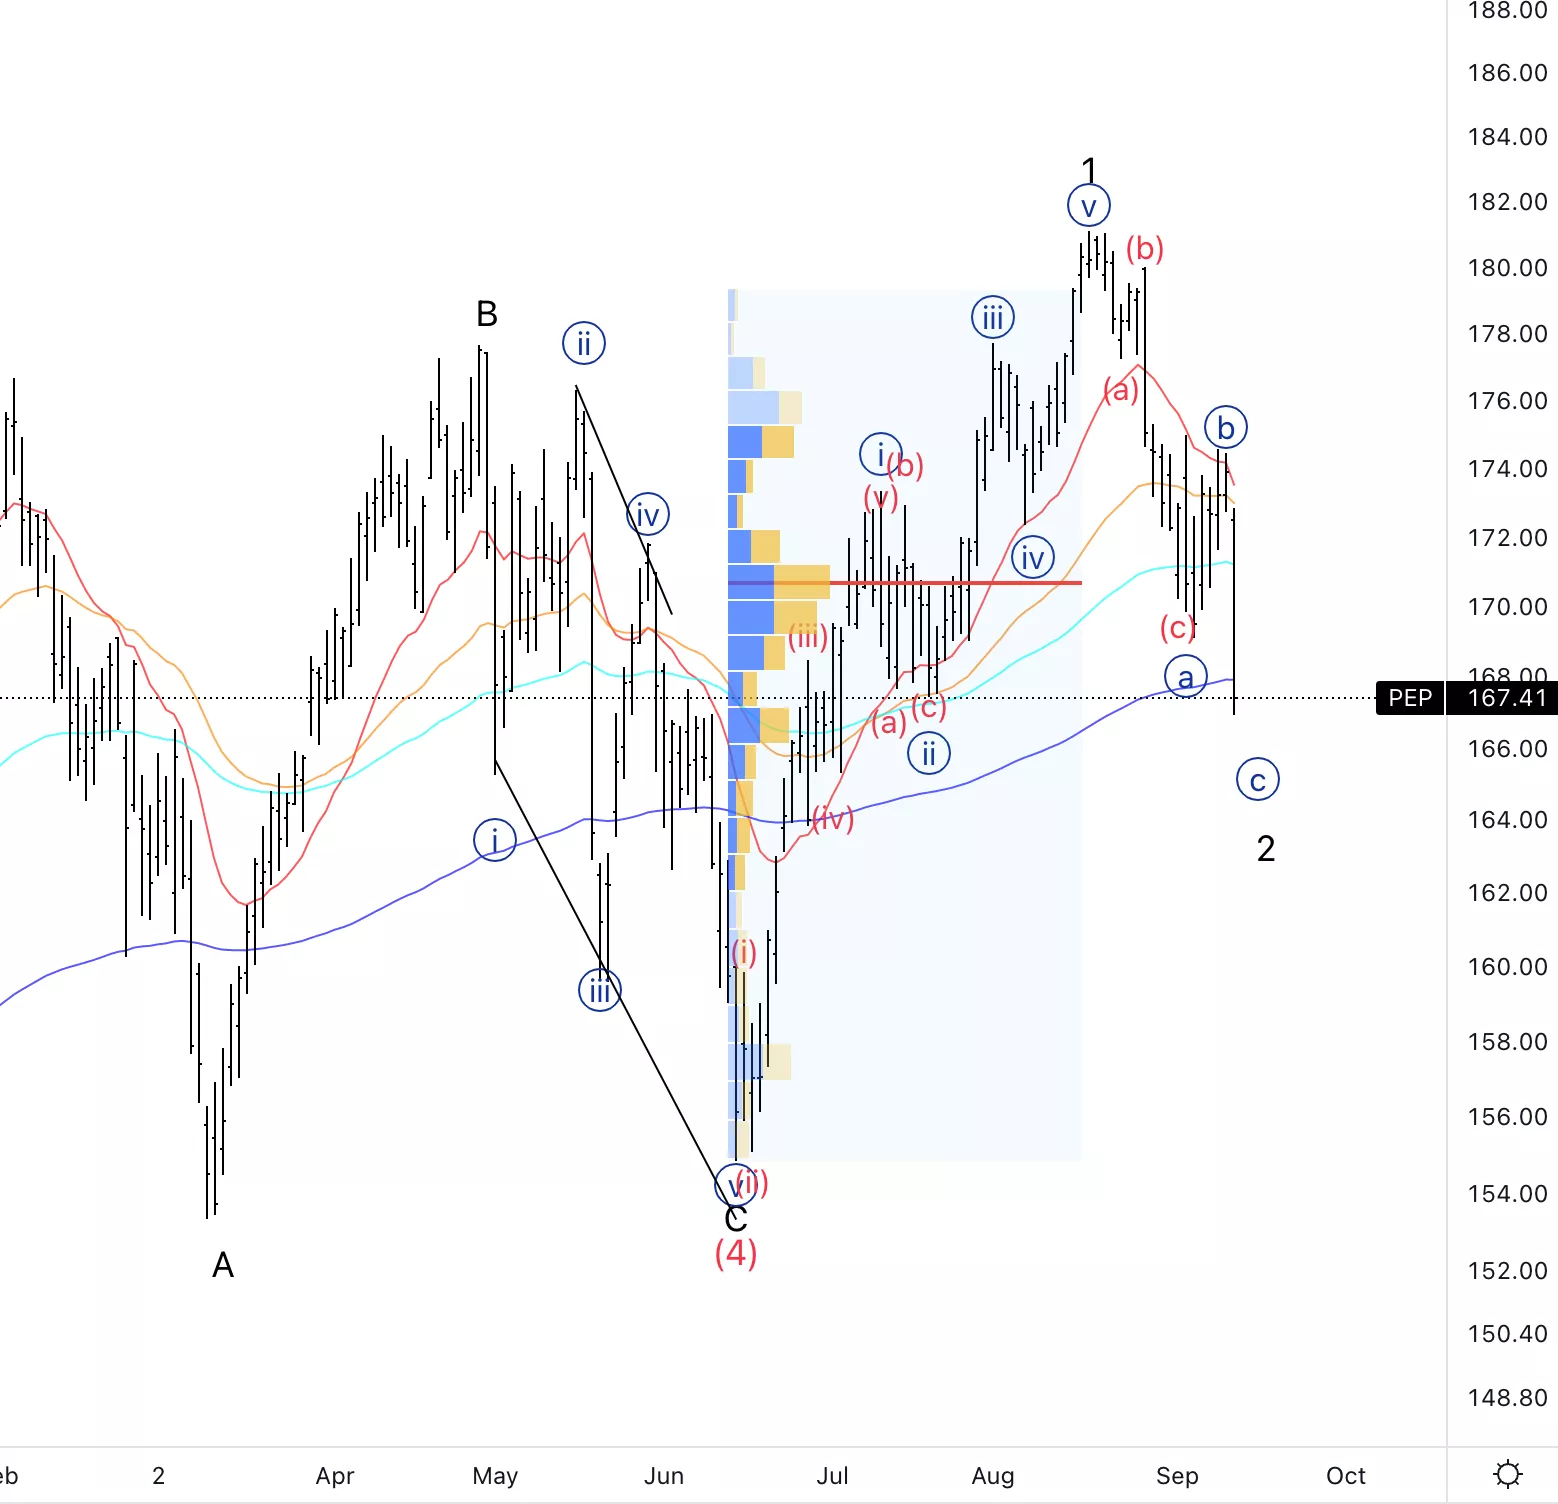
Pepsico Inc.,(PEP): Daily Chart, September 14 2022,
PEPStock Market Analysis: Moving as expected from the previous forecast. Looking at this point for a potential pivotal point to be found within a few days.
PEP Elliott Wave count: {c} of 2.
PEP Trading Strategy: Waiting for a bottom in place for wave 2 and upside resumption.
PEP Technical Indicators: We past the point of control, however we have strong volume slightly below of where we stand now.
TradingLounge Analyst: Alessio Barretta
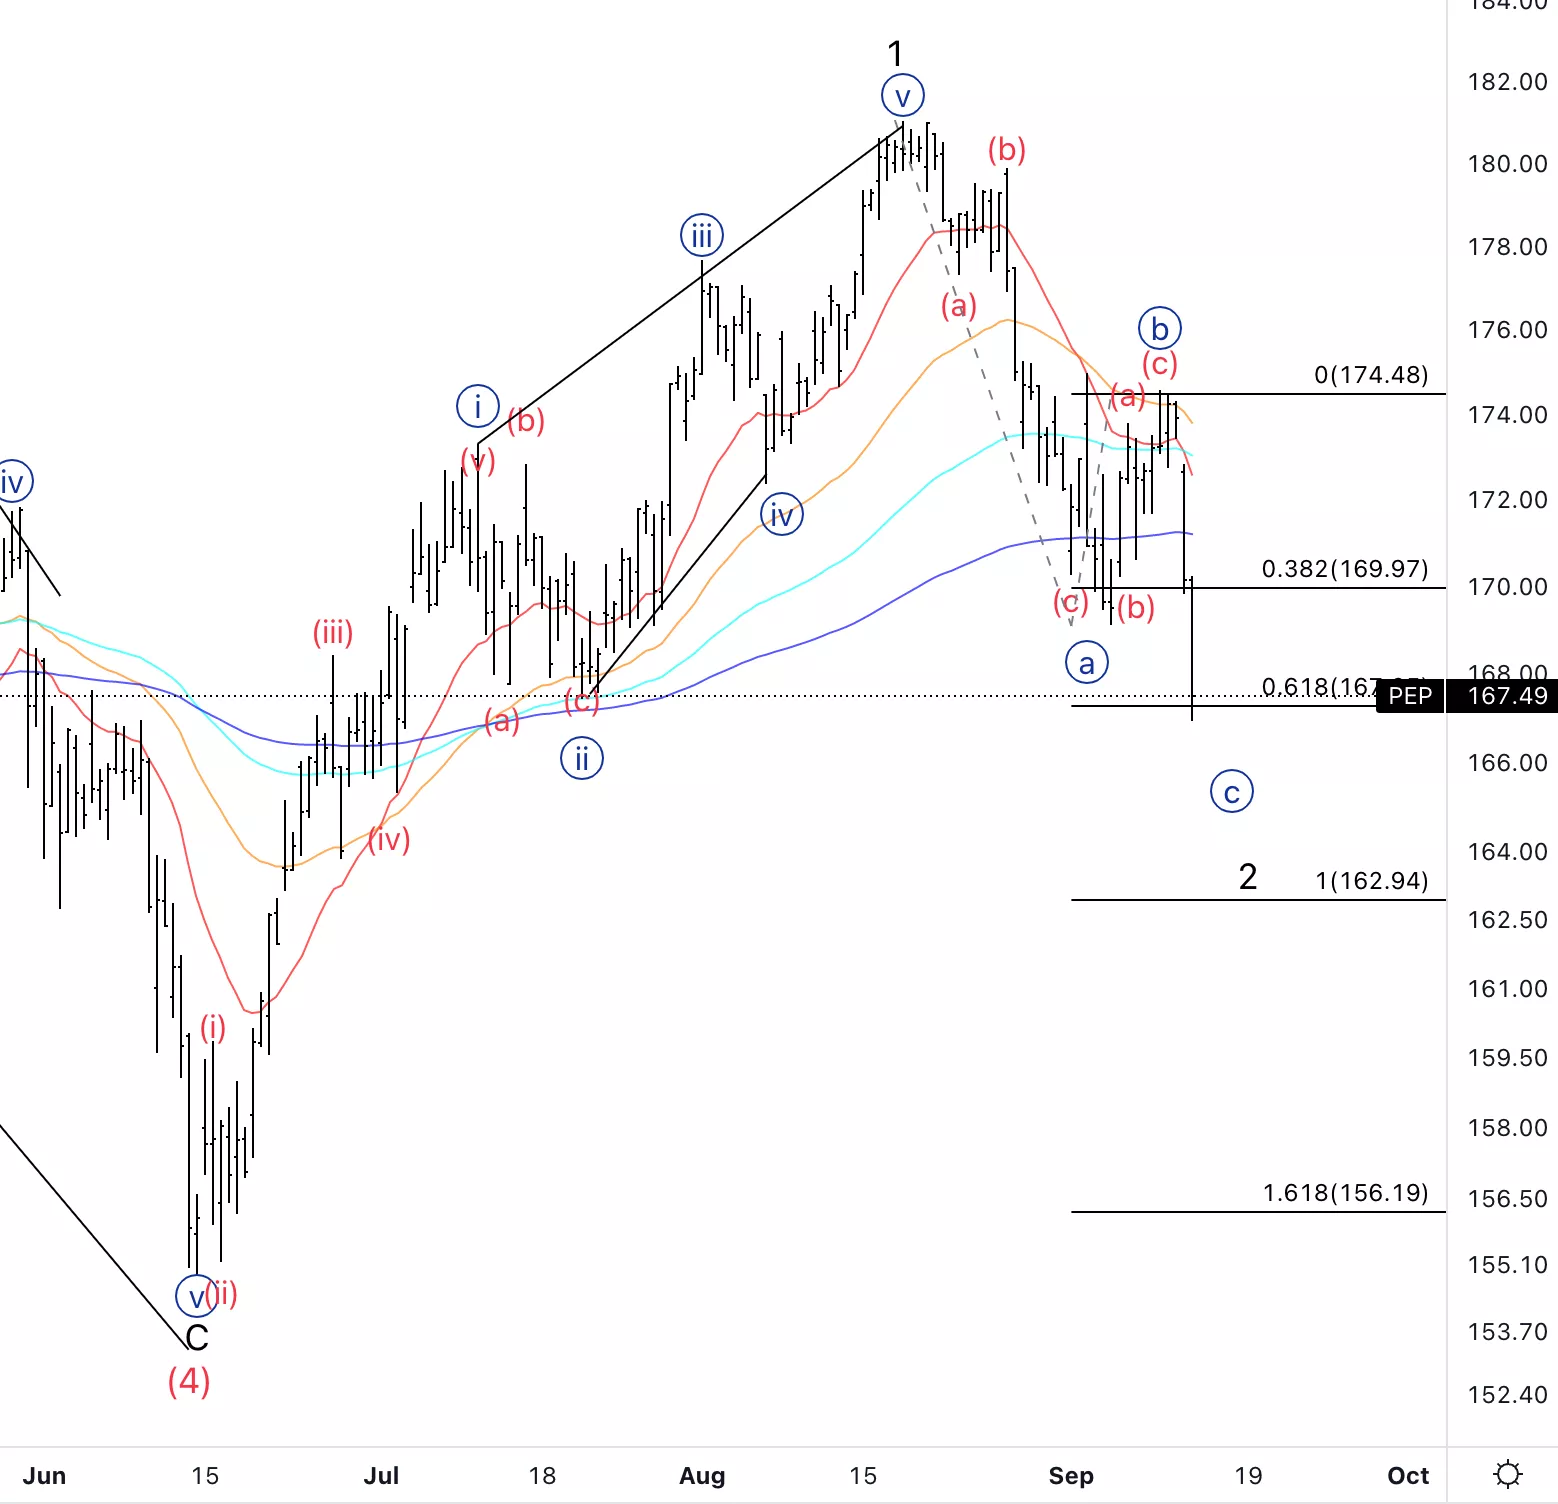
Pepsico Inc., TTD: 4-hour Chart, September 14 2022
Pepsico Inc., Elliott Wave Technical Analysis
PEP Stock Market Analysis: Perhaps we are just in wave (iii) of {c} therefore I would be expecting further downside.
PEP Elliott Wave count: (iii) of {c}.
PEP Technical Indicators: There is no reason to support any bullish scenario at the moment as we stand below all averages.
PEP Trading Strategy: Looking for downside continuation on the shorter time frames.
More By This Author:
Elliott Wave Trading Strategies: DAX 40, FTSE 100, EUROSTOXX 50, Dollar, GBPUSD, EURUSD
Elliott Wave Technical Analysis: FAANG Stocks
Elliott Wave Technical Analysis: The Trader Desk Inc.


Comments
Log in or sign up to join the conversation.