

Photo by Wance Paleri on Unsplash
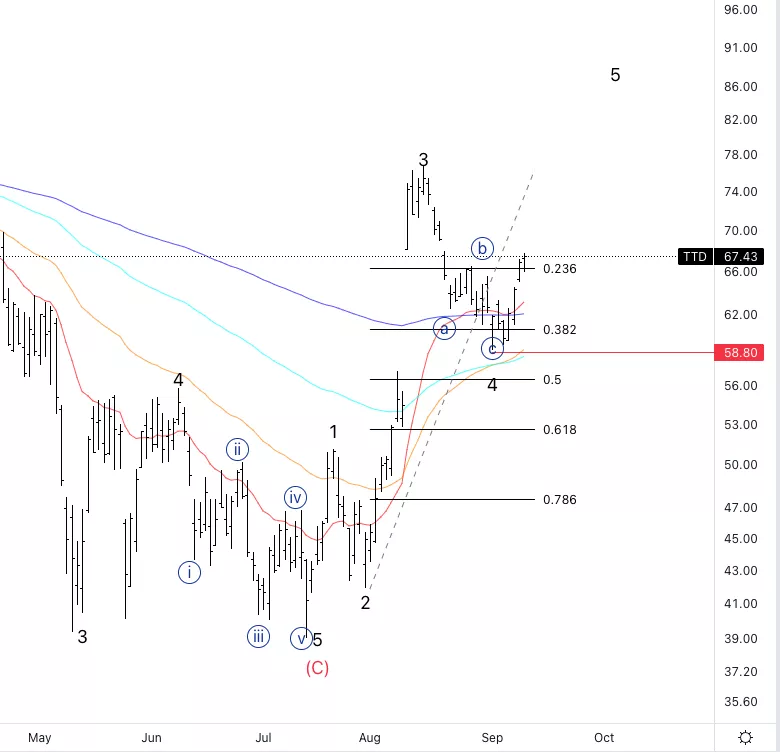
The Trader Desk Inc.,(Nasdaq: TTD): Daily Chart, September 13, 2022,
TTD Stock Market Analysis: It has been moving as predicted in the past weeks. At this point, after breaking wave {b} we are looking for an upside resumption into wave 5.
TTD Elliott Wave count: {i} of 5.
TTD Trading Strategy: Looking for a larger pullback to place longs. We could place the stop where the red line is at around 59$, or else for a more conservative trade, on the top of wave 1 at around 52$.
TTD Technical Indicators: We have had support from both the 20 and 200EMA which is a great upside sign.
Analyst: Alessio Barretta
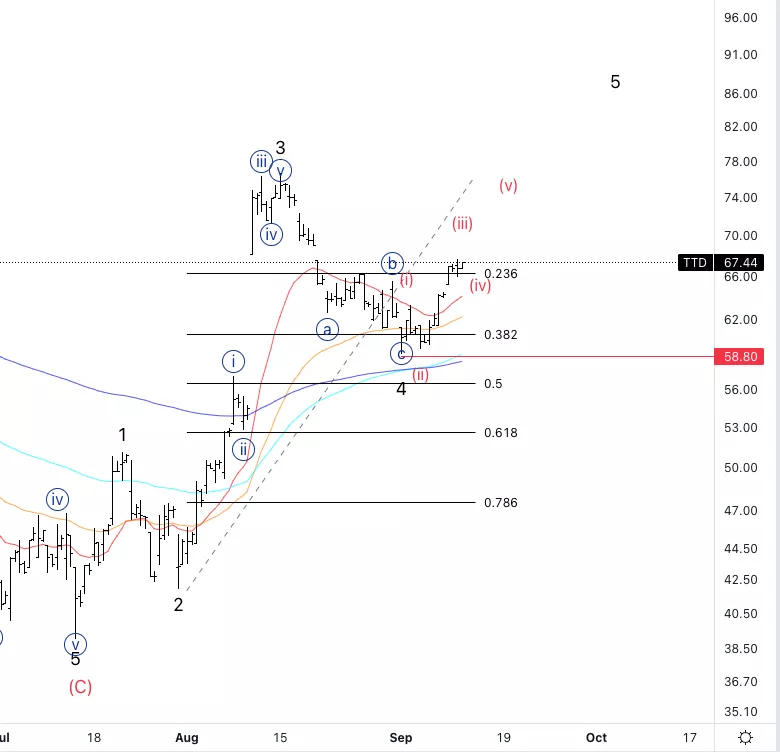
The Trader DeskInc., TTD: 4-hour Chart, September 13, 2022
The Trader DeskInc., Elliott Wave Technical Analysis
TTD Stock Market Analysis: Looking for a small pullback into wave (iv) to then have a larger retracement.
TTD Elliott Wave count: (iii) of {i}.
TTD Technical Indicators: We are above all averages.
TTD Trading Strategy: We could place longs on the small wave (iv) or else look for a larger pullback in wave {ii}.
More By This Author:
Elliott Wave Technical Analysis: Ethereum, Sept. 13
Elliott Wave Analysis: Commodity Futures Markets, Monday, Sept. 12
Elliott Wave Technical Analysis - Sept. 12: Fortinet


Comments
Log in or sign up to join the conversation.