
Fortinet Inc., Elliott Wave Technical Analysis

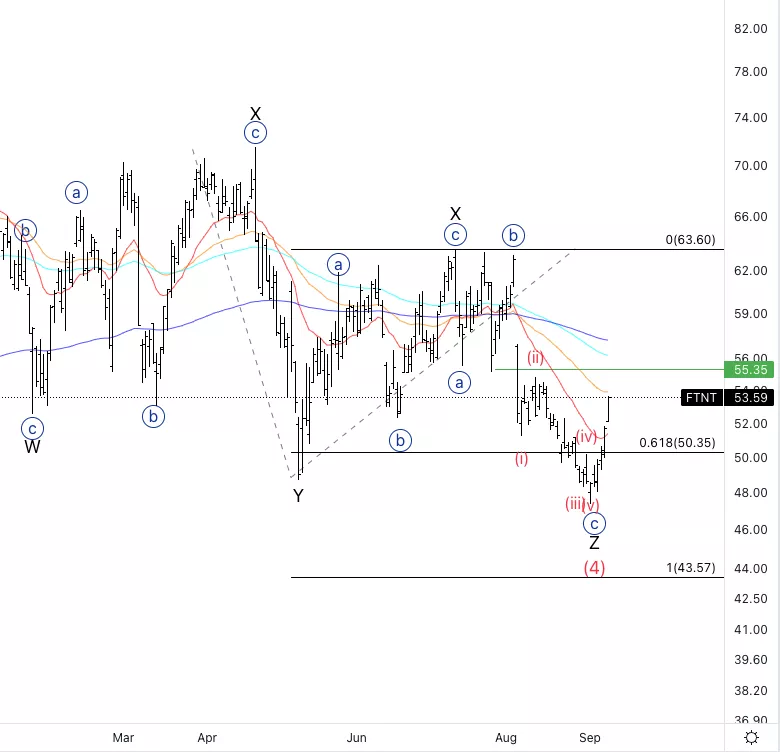
Fortinet Inc., (FTNT): Daily Chart, September 12 2022,
FTNT Stock Market Analysis:The overall correction into wave (4) seems to be completed. I am looking for further confirmation: Ideally, we would break the green line to exclude the possibility of a five wave move to the downside.
FTNT Elliott Wave count: {iii} of 1.
FTNT Trading Strategy: Looking for wave 2 to place longs.
FTNT Technical Indicators:The 200EMA could act as resistance if we move higher as expected.
TradingLounge Analyst: Alessio Barretta
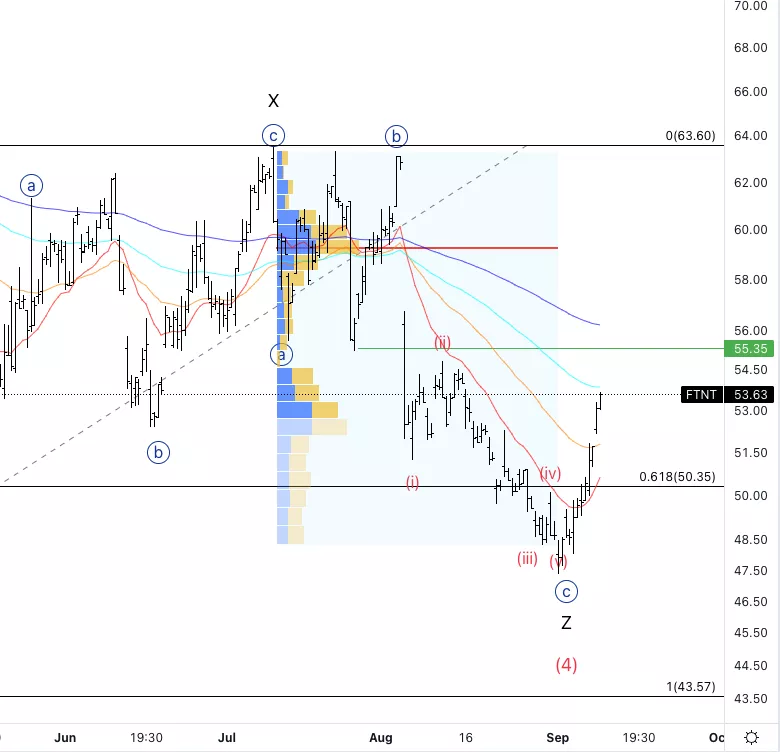
Fortinet Inc., FTNT: 4-hour Chart, September 12 2022
Fortinet Inc., Elliott Wave Technical Analysis
FTNT Stock Market Analysis: Next upside target is the break of wave (ii) of {c}. After that we can see how the point of control is slightly below 60$.
FTNT Elliott Wave count: {iii} of 1.
FTNT Technical Indicators: RSI is getting close to overbought territory which could indicate e are preparing for an incoming wave {v}.
FTNT Trading Strategy: Looking for small intraday pullbacks which should stay supported.
More By This Author:
Uniswap Elliott Wave Technical Analysis 12 September 2022
Elliott Wave Technical Analysis US Stocks, Trading Strategies
Elliott Wave Technical Analysis: PayPal Holdings Inc. (PYPL)


Comments
Log in or sign up to join the conversation.