Elliott Wave Technical Analysis, Sept. 14: AAVE Token
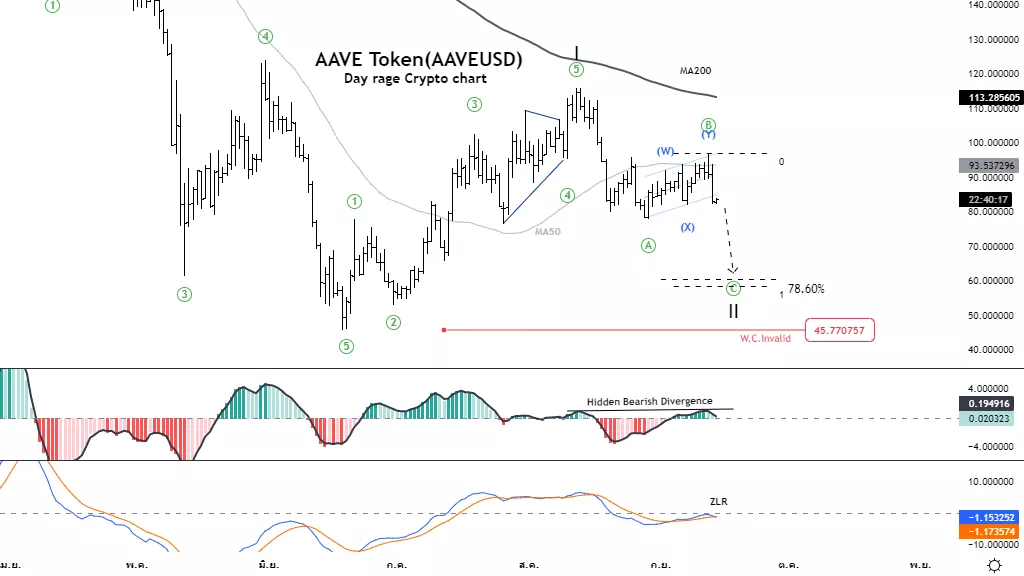
Elliott Wave Analysis TradingLounge Daily Chart, 14 September 2022, AAVE Token (AAVE-X)
AAVEUSD Elliott Wave Technical Analysis
Function: Counter trend
Mode: Corrective
Structure: Zigzag
Position: Wave ((C))
Direction Next higher Degrees: Wave II of Motive
Details: A decrease in wave C that is usually equal to wave A at 58.330.
Wave Cancel invalid Level: 45.770757
AAVE Token (AAVEUSD) Trading Strategy: Short-term, the price tends to fall further in wave C that is usual y the same length as wave A, opening up short-term trading opportunities in a downtrend.
AAVE Token (AAVEUSD) Technical Indicators: MACD Histogram has a Hidden Bearish divergence, the price has an opportunity reversal.
TradingLounge Analyst: Kittiampon Somboonsod

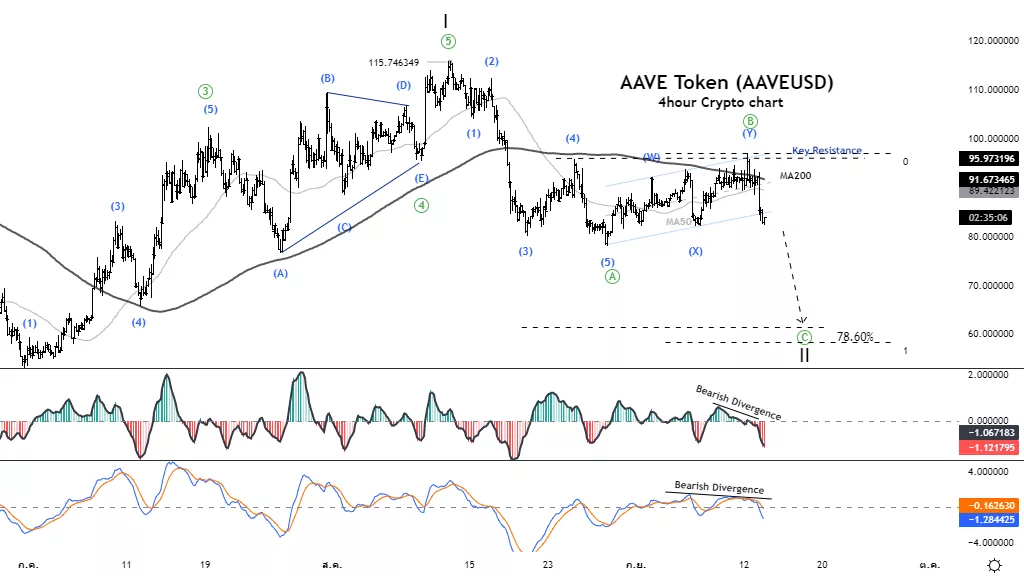
Elliott Wave Analysis TradingLounge 4H Chart, 14 September 2022, AAVE Token
AAVEUSD Elliott Wave Technical Analysis
Function: Counter trend
Mode: Corrective
Structure: Zigzag
Position: Wave ((C))
Direction Next higher Degrees: Wave II of Motive
Details: A decrease in wave C that is usually equal to wave A at 58.330.
Wave Cancel invalid Level: 45.770757
AAVE Token (AAVEUSD) Trading Strategy: Short-term, the price tends to fall further in wave C that is usual y the same length as wave A, opening up short-term trading opportunities in a downtrend.
AAVE Token (AAVEUSD) Technical Indicators: MACD and MACD Histogram has a Bearish divergence, the price has an opportunity reversal.

More By This Author:
Elliott Wave Technical Analysis: FAANG Stocks
Elliott Wave Technical Analysis: The Trader Desk Inc.
Elliott Wave Trading Strategies: ASX 200
Disclosure: As with any trading or investment opportunity there is a risk of making losses especially in day trading or investments that Trading Lounge expresses opinions on. Note: Historical ...
more


