

Do you think I've lost my mind??
Here's what's got people scratching their heads...
The market has been hitting all-time highs. New records, week after week. By every headline measure, this is a raging bull market. And if you've been watching the news, you'd think every stock in America is going straight up.
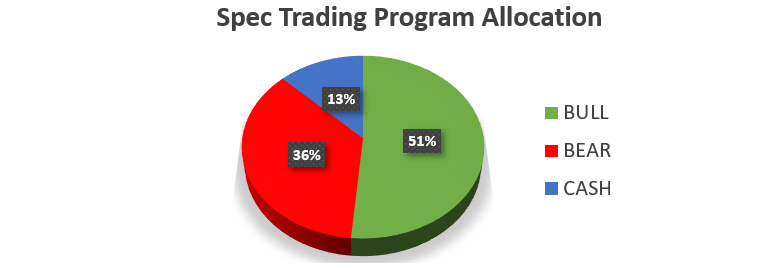
So why do I have only 51% of my capital in bullish positions right now?
As someone who's been doing this for more than 25 years, I know what the conventional wisdom says. When the market is trending higher, you get long and stay long. "Don't fight the trend" is practically tattooed on the forearm of every trader who's been around the block.
And believe me, I feel the pull of that instinct. There's a real discomfort in not being fully aggressive when the headline numbers are screaming opportunity.
But here's what I've learned after two and a half decades of doing this: one indicator is never the whole story.
When One Gauge Lies To You
Think about flying a private plane:
When you're in the cockpit, you have a rate of climb indicator. And right now, that indicator is pointing straight up. The market is climbing, no question.
An inexperienced pilot might look at that one gauge and feel great. Full throttle. Everything's fine.
But an experienced pilot scans the entire panel.
What does the airspeed indicator say? What's the altimeter reading? How are the engines performing? What does the horizon look like out the window?
Because if your rate of climb says you're going up while your airspeed is dropping, your engines are straining, and your visual horizon tells a different story... you don't just trust the one gauge that's giving you good news.
You take a more comprehensive view. You adjust.
That's exactly where I am with this market right now.
What the Other Gauges Are Telling Me
The S&P 500 is at all-time highs. That part is real. But when I look at the other instruments on the panel, the picture gets a lot more complicated.
Market breadth (the measure of how many stocks are actually participating in a rally) is poor.
The number of stocks hitting new highs isn't confirming what the index is doing.
According to data from Bespoke Investment Group, only about 20% of stocks in the S&P 500 have kept pace with the broad market's advance.
Meanwhile, roughly 37% of stocks are technically oversold.
Let that sink in. More than a third of S&P 500 components are in oversold territory at the same time the index is making new highs.
This rally isn't broad. It's narrow. And it's carried by a small group of large-cap names that have enough index weight to drag the whole number higher, even as the majority of stocks quietly struggle beneath the surface.
If you've been feeling like your portfolio isn't keeping up with "the market," this is probably why.
You're not doing anything wrong. You're just diversified into a market where most of the names aren't participating.
That's not a reason to panic. But it is a reason to look at more than one gauge before you go to full throttle.
What I'm Actually Doing About It
Here's my positioning: 51% bullish, and I have some meaningful capital on the short side — betting on stocks I expect to trade lower.
On the bullish side, I'm focused on the names that are genuinely earning their move higher.
Data center infrastructure, enterprise software, AI-adjacent companies that are seeing real demand. These are the stocks that are actually driving the index, and there's no reason to fight them.
But I'm also holding bearish positions on stocks that are showing real weakness relative to the rest of this market.
One of them is Palantir (PLTR). Despite being one of the market's high-profile tech darlings, PLTR has been struggling to hold its ground. And it's now trading below its 200-day moving average.
That's a meaningful technical warning flag, especially for a stock with a premium valuation that needs a lot of things to go right to justify its price. When a stock can't keep up in a market that's hitting all-time highs, you have to ask yourself what happens to it when the market gets choppy.
The answer, in my view, is: not good things.
That's the logic behind a more balanced book right now. It's not that I've given up on the bull market. It's that I'm reading every instrument on the panel -- not just the one that's giving me the number I want to see.
Why This Approach Works
Here's where I'll let the results do some of the talking.
The Speculative Trading Program finished 2025 with a gain of 106.4%.
So far in 2026, we're up 72.3% year-to-date.
I want to be straight with you about what those numbers mean. This is a high-risk, high-potential-reward program. We use aggressive in-the-money options on both sides of the market, and that means we have real swings... up AND down.
This isn't a program you put your entire retirement account into. It's designed for the portion of your capital where you want to be tactical and aggressive, where you can tolerate volatility in exchange for the kind of returns that can genuinely move the needle.
What makes it work (and what those returns reflect) isn't being right about the market direction every day.
It's reading all the instruments. Being willing to go bearish on weak stocks even when the headline index is green. Being willing to sit at 51% bullish when the conventional wisdom says you should be all-in. And having the discipline to trust what the whole panel is telling you, not just the one gauge pointing up.


Comments
Log in or sign up to join the conversation.