

The nowcasts indicate a slowdown.
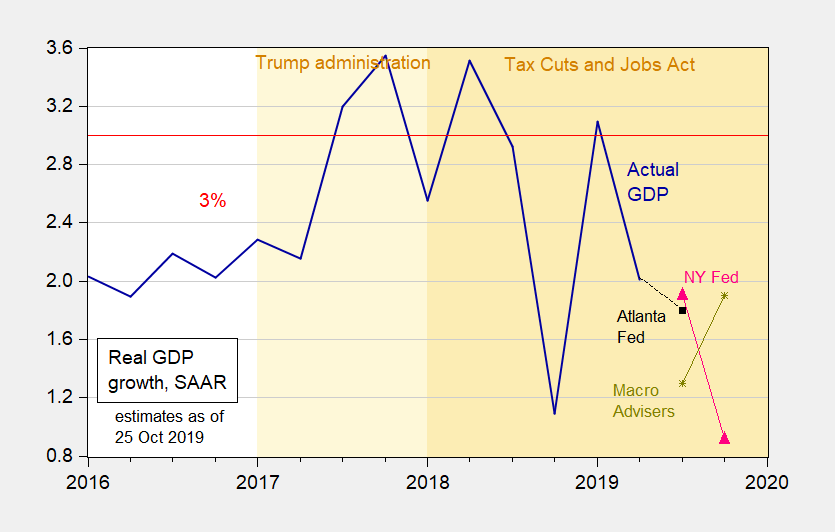
Figure 1: Quarter-on-quarter output growth as measured by GDP (dark blue), nowcasts as of October 25, from Atlanta Fed (black square), NY Fed (red triangles) and Macroeconomic Advisers (chartreuse *), all SAAR. Source: BEA, Macroeconomic Advisers, NY Fed, and Atlanta Fed.
Where are things likely to land, with next week’s GDP release? Deutsche Bank reports:

Source: Luzzetti et al. “Tracking the GDP trackers,” US Economic Perspectives, July 24, 2019.



Comments
Log in or sign up to join the conversation.