

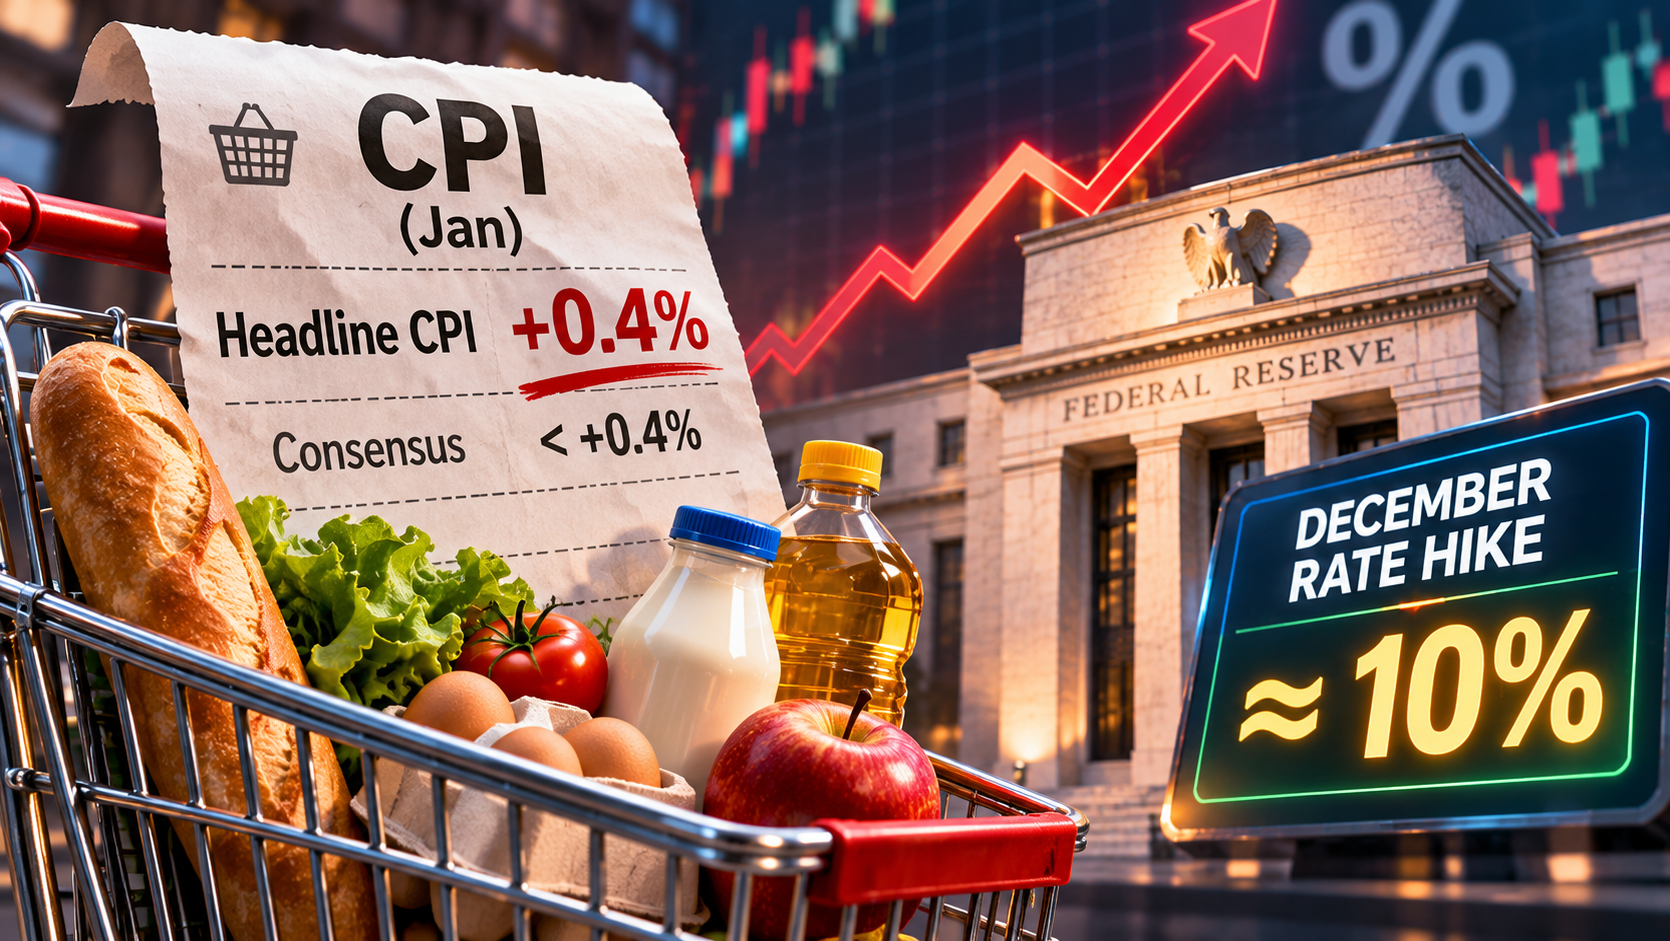
High relative to Bloomberg consensus, +0.4% vs. +0.3% m/m for headline, +0.3 vs. +0.2% for core:
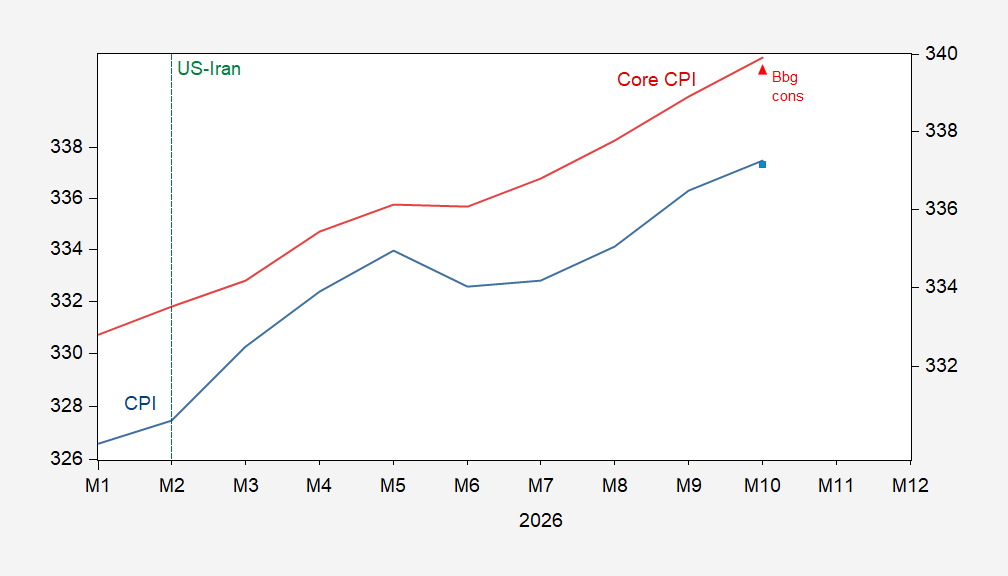
Figure 1: CPI (blue, left scale), Bloomberg consensus (light blue square, left log scale), core CPI (red, right log scale), Bloomberg consensus (red triangle, right log scale), 1982-84=100. Source: BLS, Bloomberg.
How do the various measures compare?
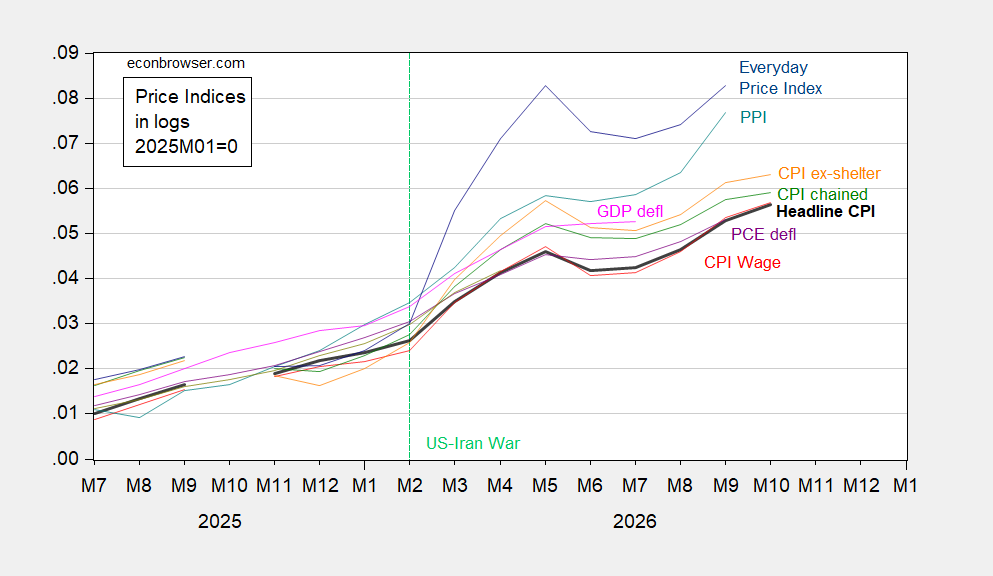
Figure 2: CPI (bold black, ) CPI wage (red), CPI chained n.s.a. (green), CPI ex-shelter (orange), PCE deflator (purple), PPI (teal), S&P Global GDP deflator (pink), AIER EPI (blue), all 2025M01=0, in logs. Source: BLS, BEA, S&P Global, AIER, and author’s calculations.
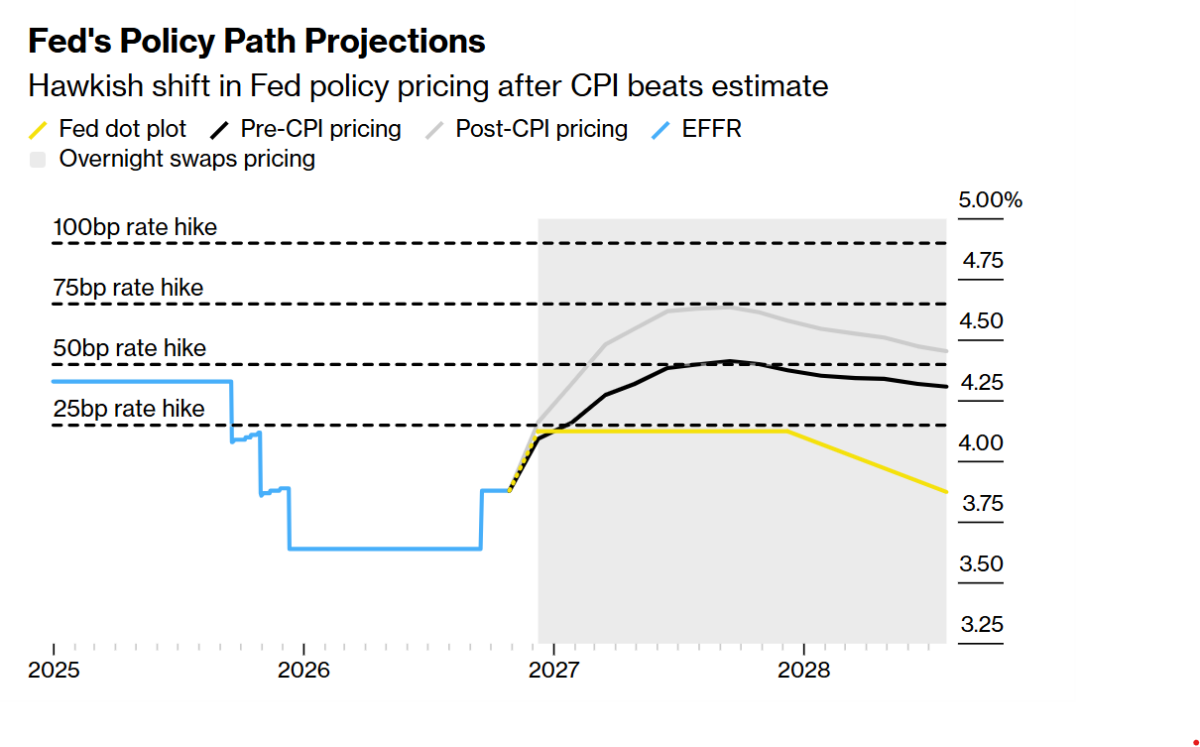
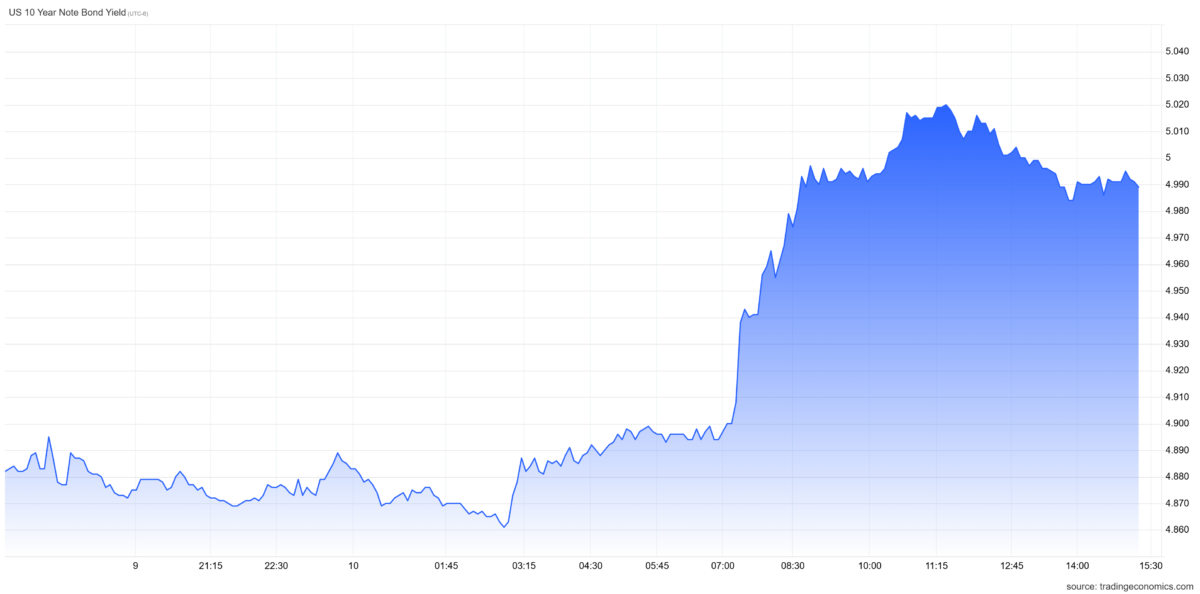
The probability of a 25bps 50bps [correction – thanks Macroduck] rate increase at the December meeting has risen from 0% to 9.8%, according to CME futures, as of 1pm CT.
Addendum, data as of 2:46 pm CT (Bloomberg):

Comments
Log in or sign up to join the conversation.