
American Civil War Union Army General William Tecumseh Sherman coined the infamous phrase: “War is hell”, as we woefully witness it occur all around the Middle East. Such events reminds us of a line from the original “35 Undeniable Truths of Life” (hat-tip R.H.L.): “Ours is a world governed by the aggressive use of force.”
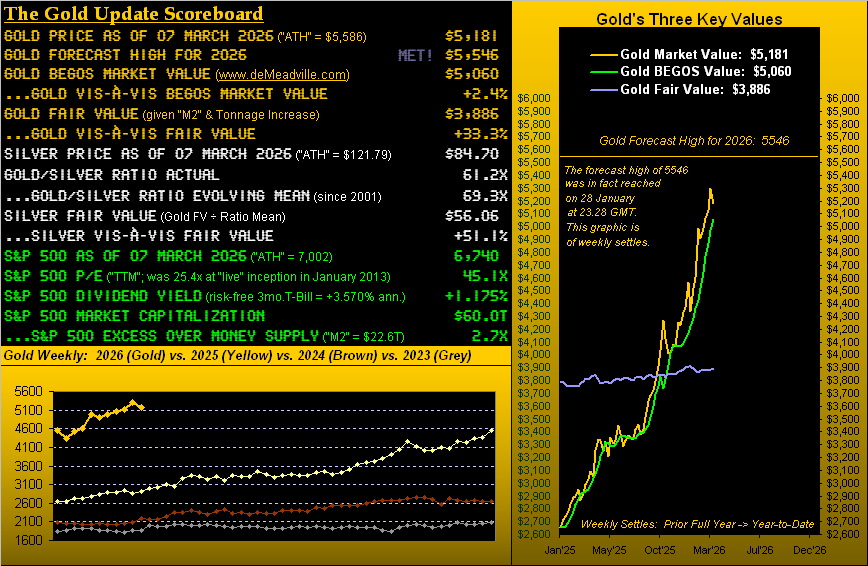
And yet from the 'History Repeats Itself Department,' gold today (as we anticipated it would be) is lower than it was prior to its pre-war settle a week ago (5296), at 5181. This is normal — as we’ve pointed out time and again — following geo-political price spikes.
Last Monday, gold initially spiked up to 5434 (-152 points below its Jan. 29 record high of 5586), only to then plunge to as low as 5005 just two trading days into the war, the exact timing as what happened back in 2022 at the onset of the Russia-Ukraine conflict.
And credit the three authors of Bloomy’s “Long-Trusted Haven Trades Are Failing as Gold, Treasuries Fall” for also pointing out such a similarity. For yet again, gold has now recorded a spike and plunge in its reaction to geo-political stress.
You may say, “because gold is ultimately valued by dollar debasement, not geo-politics, right?” You'd be spot on.
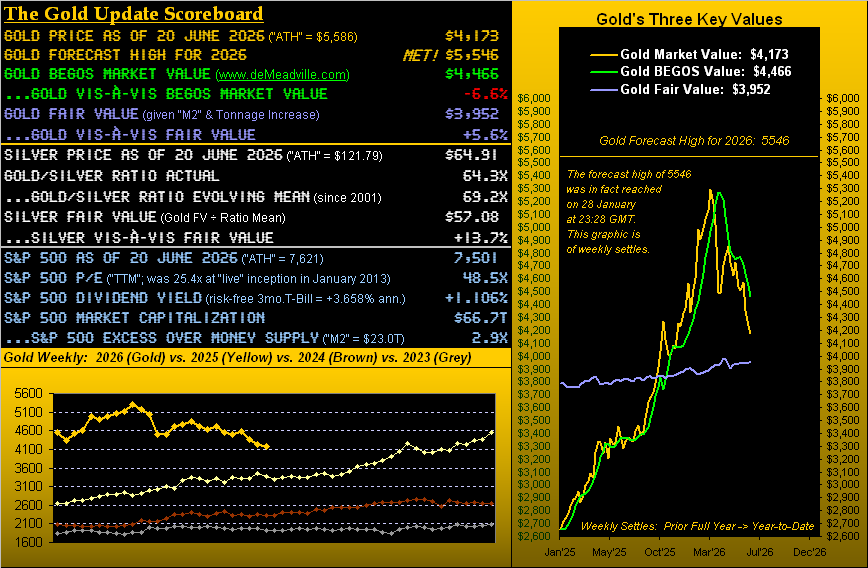
Indeed per the opening scoreboard, gold at 5181 is just +2.4% above its 'BEGOS' market valuation of 5060. Moreover, it is +33.3% above the fair value of 3886, (not that we expect the price to suddenly revert back down there).
Regardless, with the war underway, it is the dollar that’s been getting the bid (even as we’ve quipped that historically “gold plays no currency favorites”). Here are their respective percentage tracks for just this past week:
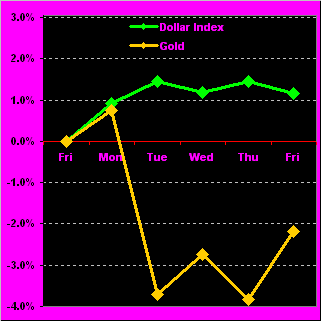
Year-to-date, gold (+19.6%) has left the dollar (+0.8%) in the dust. But again, they directionally can move together: recall in 2024, from January through mid-April, that even as gold rose +14%, the dollar, too, was on the move by +4.7%. More importantly, despite dold’s usual early-conflict slide, should warring events significantly worsen and/or widen, the yellow metal can swiftly — even if only “momentarily” — ascend into uncharted territory.
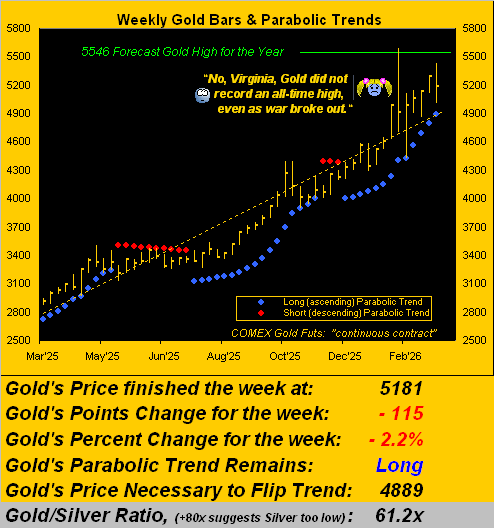
As for gold’s week just past, look no further than the rightmost bar as we turn to the weekly bars and dotted parabolic trends from a year ago-to-date. And following this new war’s commencement, we heard there was speculation of gold having made a record high (i.e., above the 5586 mark), which clearly didn’t occur.
Still, despite gold’s down week, the blue-dotted parabolic long trend printed its 13th dot, with the flip-to-short level having risen for the ensuing week to 4889. That is -292 points below the present price of 5181, which technically is reachable given gold’s expected weekly trading range is now within 318 points:
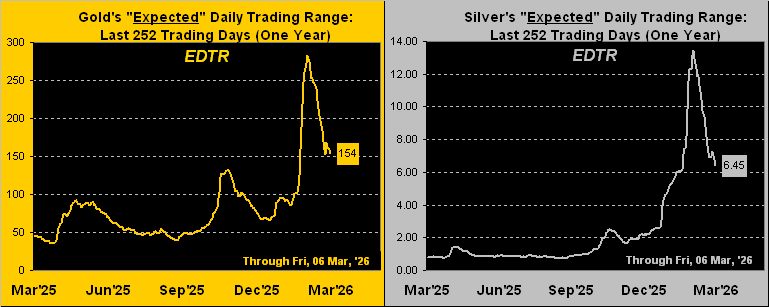
That cited, the expected daily trading ranges for the precious metals have, in fact, continued to compress. Below we’ve provided the expected daily trading ranges from one year ago-to-date for gold on the left, and for silver on the right. Note that this is not the direction of price, but rather the expected range of price from one trading day to the next. It appears these expected daily trading ranges remain well above historical norms:
As for the US economy, we’re not fully convinced of various measures being on form. To date, some reports continue to be confounded from the last October-November government “shutdown”.
Take this past week as an example: on Wednesday, Automatic Data Processing issued for February featured improved Employment data over that for January. But then the Bureau of Labor Statistics reported February Payrolls shrinkage for the first time since October (with that month’s negative data having been roughly pieced together, even as ADP reported gains).
The question is: is the Federal Reserve’s Open Market Committee being put in a stagflationary box with Payrolls declining whilst inflation is rising? Now, let's turn to the economic barometer:
In fact, for the economic barometer’s 16 incoming metrics of this past week, only three were better period-over-period, with the worst being Labor’s negative Payrolls, which also missed consensus and saw January's readings revised lower.
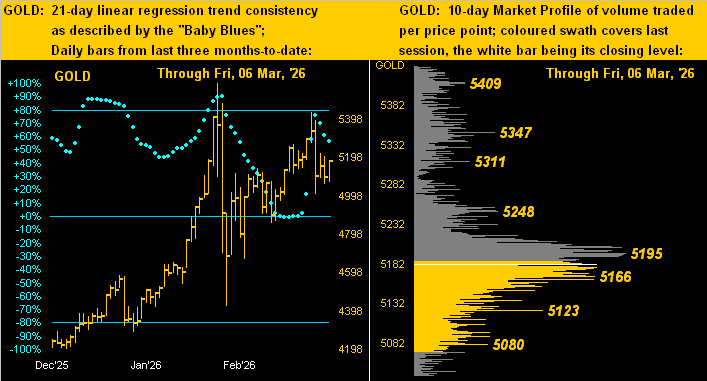
Looking to gold’s near-term movements, here are our displays of the price’s daily bars from three months ago-to-date on the left, and the 10-day market profile on the right. The blue dots of regression trend consistency survived that recent test of the 0% axis in which it briefly rotated to negative territory.
Then came the prior week’s bounce, followed by last week’s trounce. It may be wise to follow the pattern of the blue dots rather than that of headlines, even as the ride as of late has been a bit erratic. Note that gold’s present price of 5181 is just below the most volume-dominant resistor, as labeled at 5195:
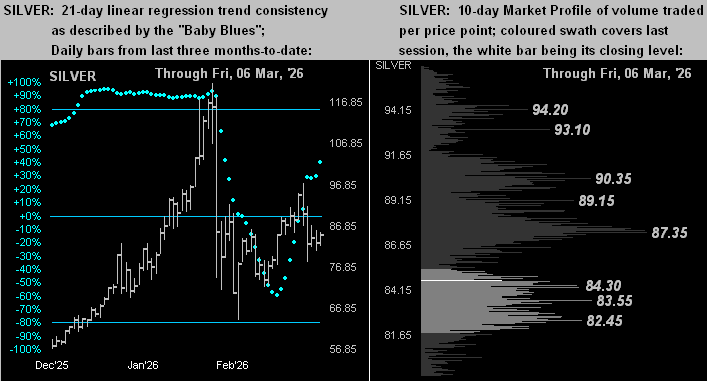
Here, too, we’ve provided a look at silver, which settled Friday's trading at 84.70. Silver's blue dots pattern appears to have much more of a sweeping formation than that of gold. In fact, silver’s mid-panel price plunge registered -48%, whereas that above for gold was “only” -21%.
As for silver's profile, the gray metal has been sitting on volume-dominant support from 84.30 down to 82.45. According to its scoreboard, silver’s fair value of 56.06 is -34% below the present price. Hang in there, silver.
As we wrap up, we'll take a look at the 'Financial Media Exaggeration Department'. Of the nine full trading weeks thus far this year, the past one for the S&P 500 ranked third for total points distance traveled (6901 to 6710, i.e., -191 points, or -2.8%). Yet, an intra-day drop of -1.96% on Thursday for the Dow was reported by a financial source as a “crash”. It seems they don’t know what a crash looks like.
But the best adjective we saw came (again) from Bloomberg, referring to the Middle East war as having roiled the markets (and selectively highlighting oil). Having closed the prior Friday at 67.29, West Texas Intermediate Oil reached up to as high as 92.61 yesterday, marking an intra-week gain of nearly +38% to a price not seen since Sept. 29, 2023. And with the Straits of Hormuz being characterized as “shut”, TV news here showed cars in long lines for petrol in places like Nice and Grasse. Back to the 70s we go? We hope not.
But with respect to energy consumption there is some good news: the US won't be burning as much midnight oil. Why? Because with two full weeks of winter still in the balance, the states will transition into summer hours tonight.
Why do we care? Because given the long-standing tradition of The Gold Update being posted each Saturday at 11:00 Pacific Time, if you’re outside most of North America, the following three editions can be read an hour earlier, as on this side of the pond, we’ll still more sensibly be on winter hours until March 29 (thus in this CET time-zone at 19:00 instead of the usual 20:00).

Comments
Log in or sign up to join the conversation.