

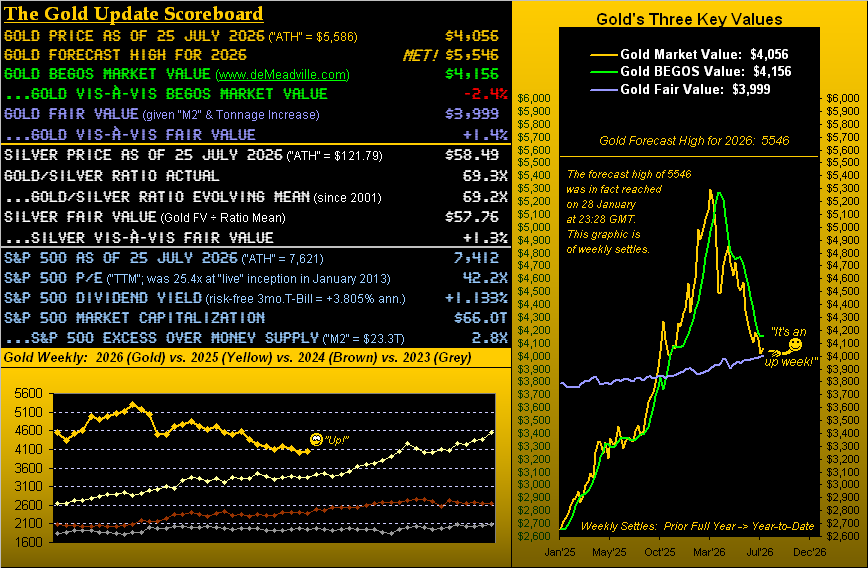
Our having taken on more of a bullish bent these last few weeks, we ~finally~ can open with some pleasing news: Gold just recorded an up week.
“Well, it really wasn’t much of a big deal, mmb… ”
True enough, Squire. Yet thus far through the year’s 29 trading weeks, Gold just recorded only its fourth positive one in the last 14:
“Happy days are here again…” –-[Milton Ager & Jack (not Janet) Yellen, ’29].
Indeed en route to settling this past week yesterday (Friday) at 4056, price rocketed higher from Monday into Wednesday, at one point up +3.7% to 4171. But we’ll gladly accept the week’s net gain — wee as ’twas (+0.8%) — after all the recent fits and starts — dare we saying “derring-do” — that Gold’s been through.
Further, Gold (serendipitously or otherwise) has been fostering friendship with Fair Value.
“That’s ’cause you’ve been pointing it out a lot, mmb… ”
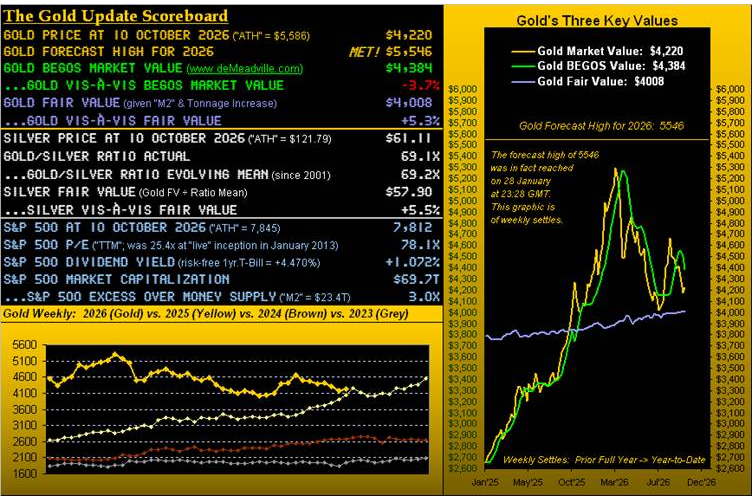
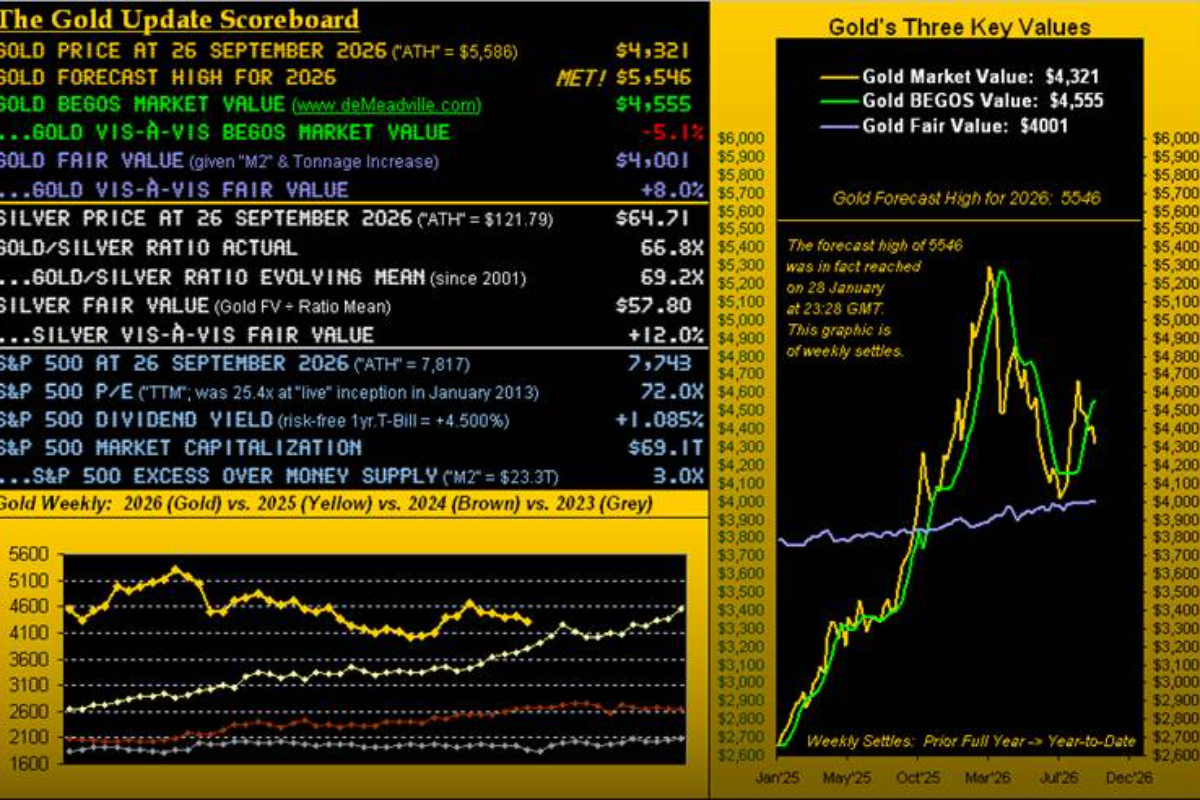
Squire, we appreciate the supportive comment. Either way, Fair Value remains our favoured — albeit the most particularly ponderous measure — for reasonable Gold valuation. To be sure, Fair Value shall be a bit of a laggard to the actual price of Gold upon the Federal Reserve having to bail out both the U.S. Treasury’s debt and to fund investment banking coffers (thus avoiding your receiving an I.O.U. instead of cash upon selling your stock) given the ratio of the S&P 500’s market capitalization/liquid money supply is now 2.8x (per the opening Scoreboard). In the offing then comes five-figure Gold, as previously we’ve herein foretold.
But again, the beauty of Fair Value (barring a deflationary depression and a sapping/reinvention of the money supply) is that it rises over the long haul. Yes, since President Nixon nixed the Gold Standard back on 15 August 1971, the price of Gold has typically trailed Fair Value, only to have dramatically caught up — and then some (understatement) — upon Gold last year having “morphed into a meme stock” as the trading herd changed the yellow metal’s status from “Relic” to “Must have it!”
All that said, we oft think of Gold as an attractive, very long-term buy when trading at or below Fair Value. Here from one year ago-to date are Gold’s daily bars and gradually rising Fair Value line. Note therein Fair Value’s rightmost “supportive” nature of late:
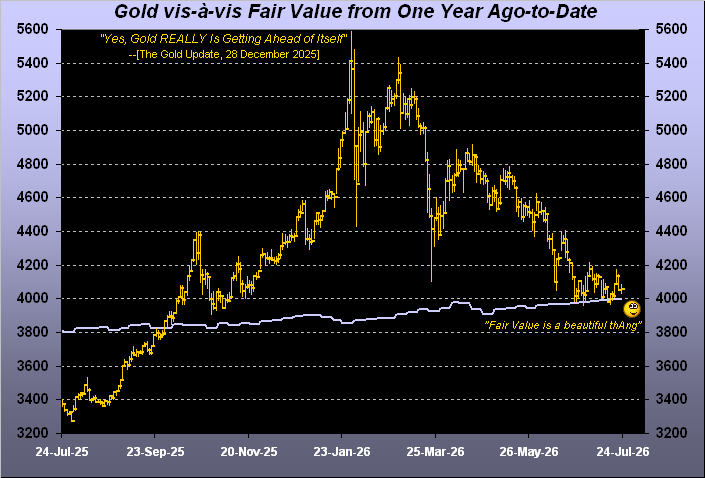
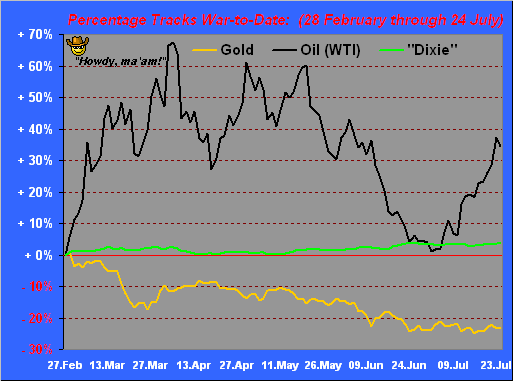
‘Course, from the “Double Negative Dept.”, Fair Value presently appearing “supportive” doesn’t preclude Gold not going down. The war is weary on Gold as the Dollar rises toward accommodating the transaction of Oil. Thus here we’ve the percentage tracks war-to-date of Gold, Oil (West Texas Intermediate) and the Dollar “Dixie” Index. The latter’s line lacks alacrity based on how ’tis priced by ICE (Intercontinental Exchange); but since the war’s commencement on 28 February, “Dixie” is up nearly +4%, which historically across any 101-trading day range (per this case) is fairly exceptional:
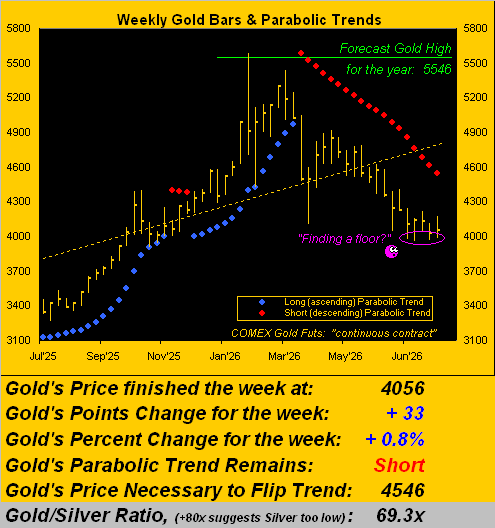
Regardless, Gold’s weekly parabolic trend continues its Short course as we go to the bars and dots from one year ago-to-date. And yet, is Gold finally finding a floor? Aided or not by Fair Value (now 3999), price is fighting to maintain 4000. Still, ’tis a bit of a stretch to flip the trend back to Long: as below shown, such price for the ensuing week is 4546, requisite of an up move of at least +490 points (+12.1%). Has Gold every gained +12.1% in a single week? Century-to-date, just once for that ending 19 September 2008 as it all went wrong for equities et alia into the FinCrisis. As for Gold’s expected weekly trading range, ’tis now 235 points, in which vacuum ‘twould take price more than two “straight-up-weeks” to set the trend Long. Yet favourably — should this be a floor — for Gold’s upside there’s more, (subject to the state of the war):
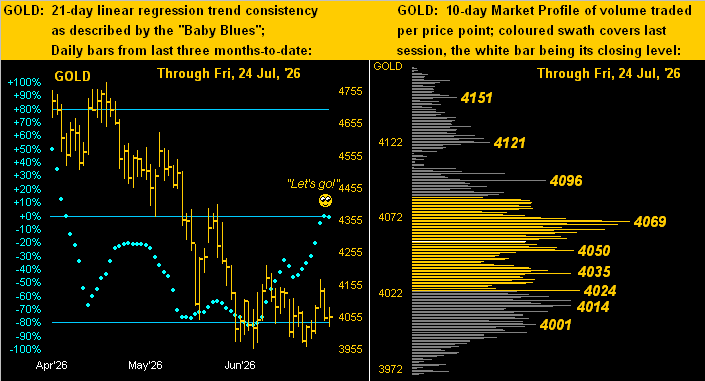
Next in drilling down to “The Now”, we go to our two-panel Gold graphic featuring the daily bars from three months ago-to-date on the left and 10-day Market Profile on the right. Should you regularly read the website’s daily Prescient Commentary, you’re aware of our notion for Gold’s 21-day linear regression trend rotating toward positive: we’d been anticipating ‘twould happen by last week’s end; but then the war re-heated again and Gold lacked the puff to rotate as such, evidenced by the baby blue dots not quite clearing the 0% axis. However: if Gold is putting in a floor, we ought see the new positive trend evolve into next week. Else by the Profile, price is fairly centered, supported by a nearby array of volume-dominant levels as labeled, although the big point over which to come is 4069:
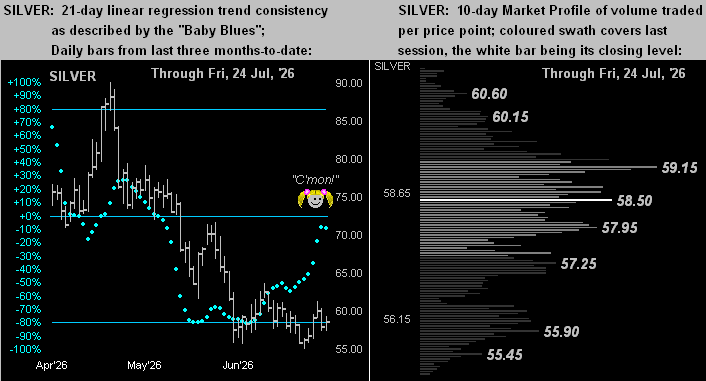
Too, Silver continues to perform in line with Gold. Here we’ve her like panels with the “Baby Blues” (below left) and Profile (below right). Should Sister Silver clear her most volume-dominant resistor as labeled at 59.15, it ought be “Hello 60s!”:
Be that as it may, the wildcard remains the war which from one day to the next waxes and wanes on that being said from behind the White House’s window panes. Cue The Temptations’ hit from back in 1970:
“Ball of Confusion (That’s What the World Is Today)”
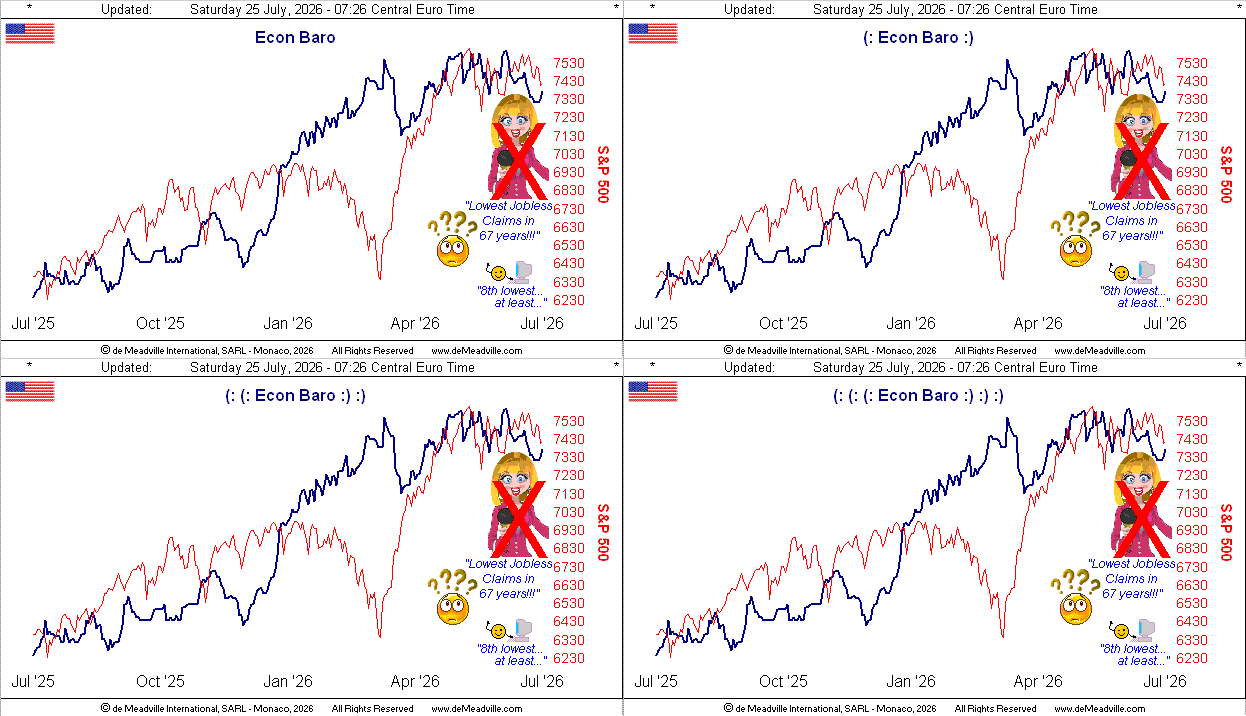
Which is a neat segue into the Economic Barometer. The Baro has been in a confused state for some three months, yet fortunately had a deserved rest this past week as just three incoming metrics arrived, the downer being the Conference Board’s Leading (i.e. “lagging”) Indicators for June. But the month’s New Home Sales beat both consensus and those for May, which also were revised higher. Moreover came the math-challenged FinMedia excitedly reporting that Initial Jobless Claims for the week ending 18 July at 187k were the lowest since 1969. Wrong: since the Baro’s inception in 1998, there’ve been not one but seven other weeks of less Claims, the least being 167K for the week ending 02 April 2022. (Still watching that FinTV, Bunky? Bummer). Here’s the Baro:
With respect to stocks, yesterday we received a solicitory email with the subject “Are you ready for the crash?” We’ve been ready for four years. “Oh, but earnings season is so great!”, they say. Year-over-year, yes, thus far ’tis “great”. Of the 118 S&P 500 constituents having reported, 85% (100) have recorded bottom-line improvement. But from “The Record Needle is Stuck Dept.” we again point out that to sustain such excessive levels of prices, earnings ought be doubling, if not tripling.
“But they’re not, right mmb?”
No they’re not, Squire, although the S&P’s “live” price/earnings ratio has come down a bit through these first three weeks of Q2 Earnings Season from 46.5x to now 42.2x (again per our opening Scoreboard). For you WestPalmBeachers down there, that means if you buy the S&P today, you’re paying $42.20 for something that earns $1.00. Sure, one can add in the teeny 1.133% dividend yield, but prices (believe it or not) can actually go south. ‘Course, they always come back, right? Recall it took the S&P 500 a mere 13 years to record a 2% peak-to-peak gain from 2000 into 2013 … just in case you’re scoring at home.
Obviously we find this more preferential:


Comments
Log in or sign up to join the conversation.