

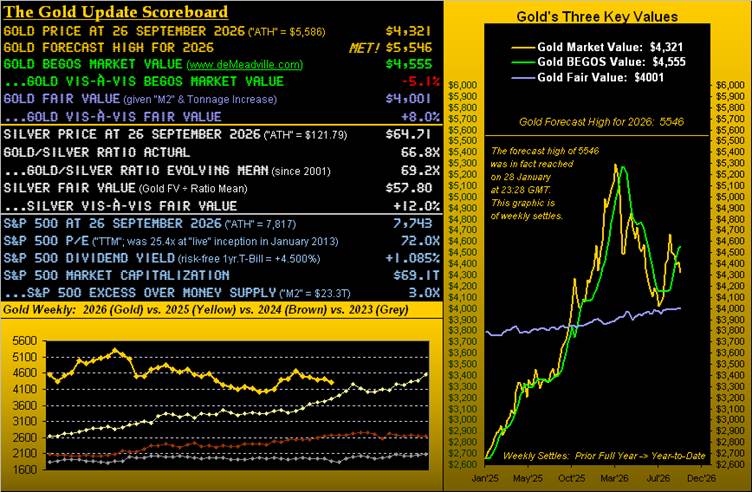
We honestly hope we’re wrong about this, but in a 180° about-face from our 15 August missive entitled “Still Higher Gold Ahead” — after which price indeed swiftly increased +7.3% from 4432 to 4755 — we now herewith have “Still Lower Gold Ahead”.
Ongoing war and inflating rates continue to play havoc with the Gold price, which just recorded its fourth down week in the past five. Oh, to be sure, Gold’s weekly parabolic trend is surviving the Long side; but as we herein penned two weeks ago, the case for: “an otherwise pending change from Long to Short trend, perhaps by month’s end” appears just ’round the bend. Thus let’s straightaway start with Gold’s weekly bars and parabolic trends from a year ago-to-date:
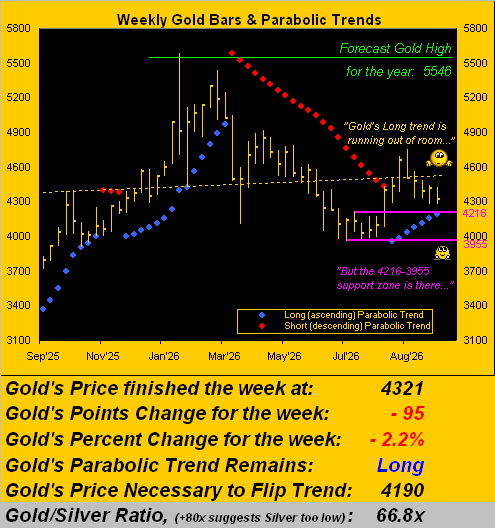
In having settled this past week yesterday (Friday) at 4321“plop”, Gold now sits but +131 points above the parabolic trend’s flip-to-Short level of 4190. Such “running out of room,” given price’s expected weekly trading range now being 216 points, the Long trend clearly is in jeopardy. Too, the graphic’s Gold-dashed regression trendline — which has been positively sloped since mid-March 2023 — is nearing rotation to negative.
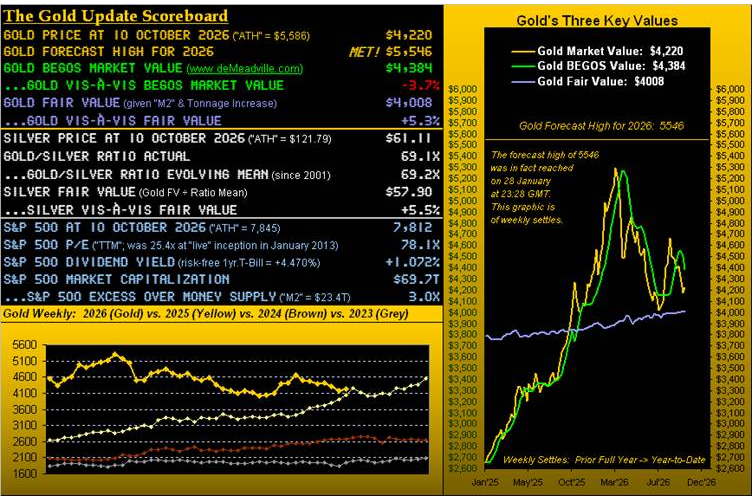
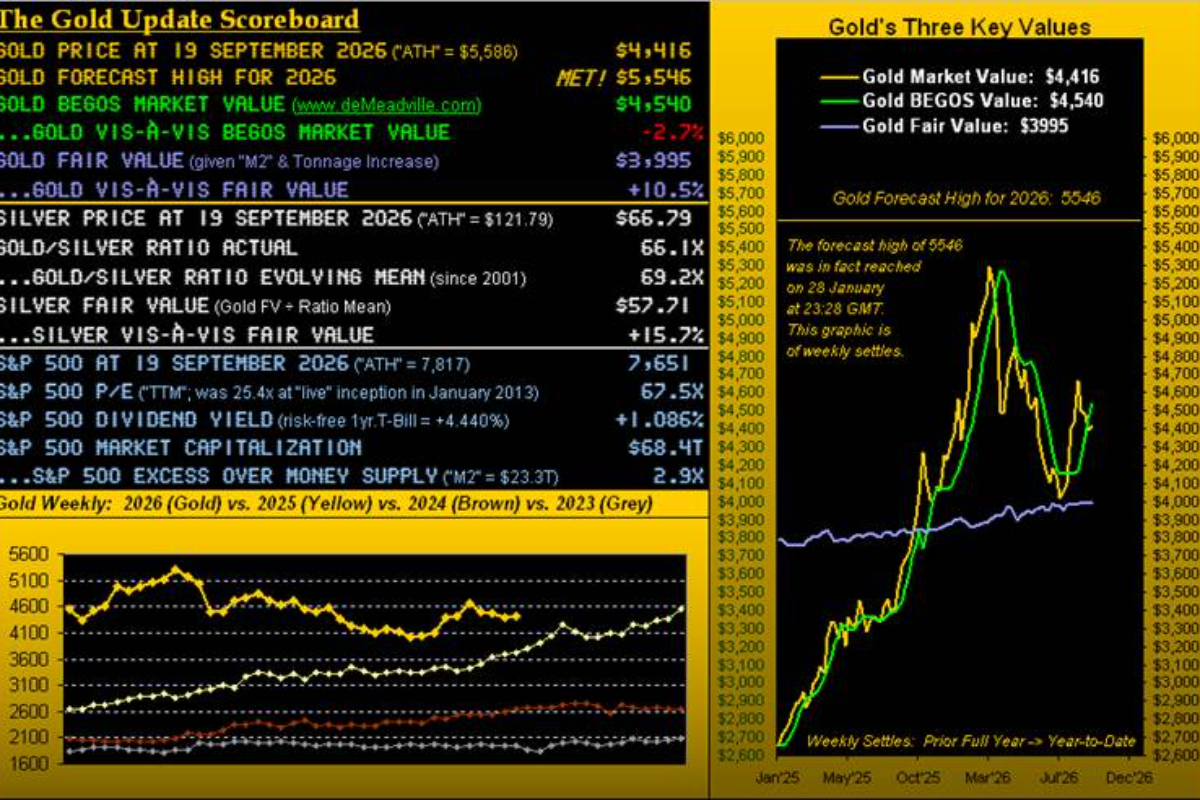
Yet fortunately, as also depicted there, we’ve the 4316-3955 support zone, encompassing “The Floor” of 4000 (which you’ll recall we’ve on occasion cited). As well, by the opening Gold Scoreboard, Fair Value today is 4001. Recall the prior test of Fair Value (then 3979 back on 26 June) immediately brought in the buyers, price in due course reaching the aforementioned recent dominant high of 4755 (on 25 August).
The point is: even should price in the next week or two succumb to a parabolic Short trend, we anticipate ’twill be comprehensively pun-intended short-lived.
Neither let us dismiss what we penned a week ago, that our “leading deMeadville metrics are near to churning favorably for Gold, especially were the war to quickly wind down (albeit doubtful), and the August PCE come in Fed-friendly (also doubtful).”
“But those ‘doubtfuls’ ain’t goin’ away, huh mmb…”
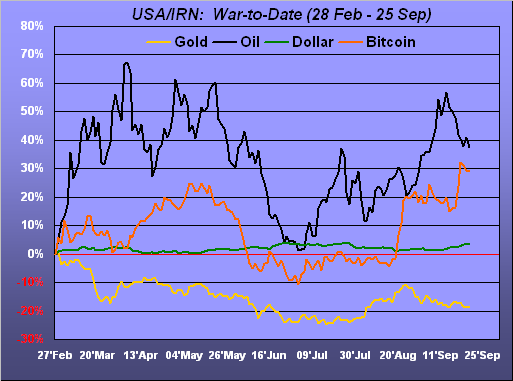
Squire, the “doubtful” of the USA/IRN (dare we say “et alia”) war-to-date has thus far never rescinded to anything better than a stalemate. And notwithstanding the Stateside mid-term election (03 November), there is musing amongst the punditry that the conflict shall extend into next year (aka Korea, Viet Nam, Afghanistan). The negative effect on gold, as the Dollar gets the bid to purchase Oil, has been awkwardly cumbersome. To wit, here are the percentage tracks since the inception of the war from 28 February to date of Gold, Oil, the Dollar Index and (as ’tis again getting a bid) Bitcoin (BTC.X). Note: the way the Dollar is priced, the percentage alacrity lacks that of the other markets; but its small percentage moves can have large effects, as clearly is the case on Gold:
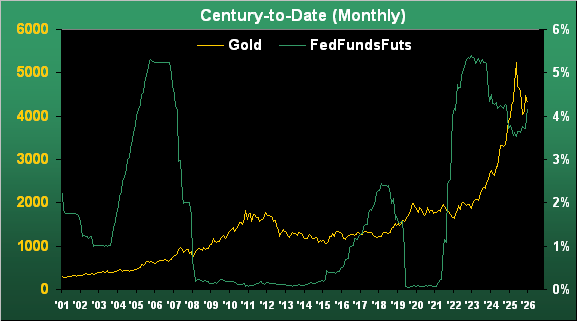
As well, next week brings the “doubtful” of the “Fed-favoured” Personal Consumption Expenditures for August, both the headline and core paces expected to be at three-month highs. Moreover, the FedFunds futures are priced above the current 3.750%-4.000% target range, now at 4.175%, and thus are leaning toward another rate hike come the 28 October Policy Statement from the Federal Open Market Committee. Conventional wisdom sees rising interest rates as Gold-negative, although hardly is that axiomatic as below we make evident so far this century:
Then there’s the Economic Barometer into which this past week came a scant five metrics. Four of them period-over-period were better, most notably August’s New Home Sales by beating consensus with July revised upward. But: “Hey buyers! How are those higher mortgage rates workin’ out for ya?” Here’s the Baro: does it necessarily have a Fed hike lean? Come Wednesday, we’ll get the PCE scene within a week of metrics totaling sixteen:
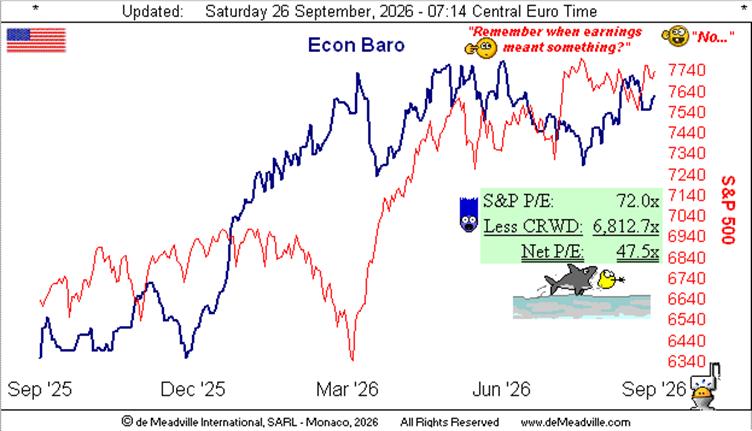
Now drilling deeper into Gold, here we’ve our two-panel display of the daily bars from three months ago-to-date on the left and 10-day Market Profile on the right. Again, “churning” Gold positive may be the baby blue dots of regression trend consistency having (at least for the moment) curtailed their fall. The aforementioned support zone is the leftmost cluster of bars. As to the Profile, a week ago price was 4416, whereas now at 4321 ’tis beneath volume-dominant resistance at initially 4327 and then at 4390, making it appear a rocky upside road for Gold:
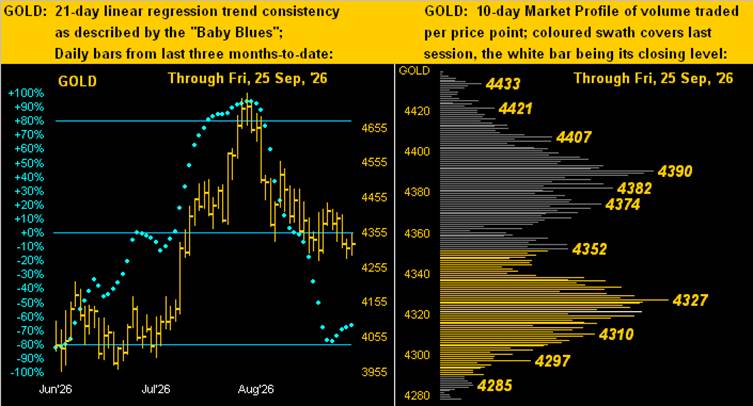
And here we’ve Silver’s like graphic. Long-time readers of The Gold Update know that when Sister Silver is cavorting with Cousin Copper, the white metal’s graphic doesn’t always align well with that for the yellow metal. But as Silver these recent months has been wearing her precious metal pinstripes (as opposed to her industrial metal jacket), both sets of graphics (above and below) appear quite identical:
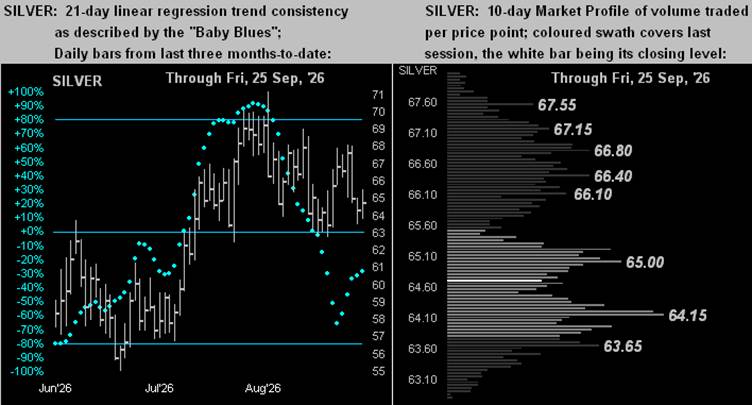
Thus, on rolleth The Investing Age of Stoopid. Over here, the pros we know are on the edge of their deck chairs waiting for the S&P to crash, whereas the under-40 crowd are chasing — well — CrowdStrike (CRWD) and the like.
Meanwhile, from the “Cash Is King Dept.”, UBS (UBS) opines that cash is a “poor” long-term investment as it yields less than 1%. Guess what also just barely yields 1%? The S&P 500 (per our opening Gold Scoreboard). So is the S&P thus, too, a “poor” investment? Remember (as we’ve on occasion mentioned): it took the S&P over 13 years from 2000 into 2013 to net a gain of just +2%. Not to worry, however: the once-mighty Barron’s opined this past Thursday that “Stocks Are Resilient, Fairly Priced, and Probably Getting Ready to Rally”. Let’s therefore wrap as we again update this old-timer:
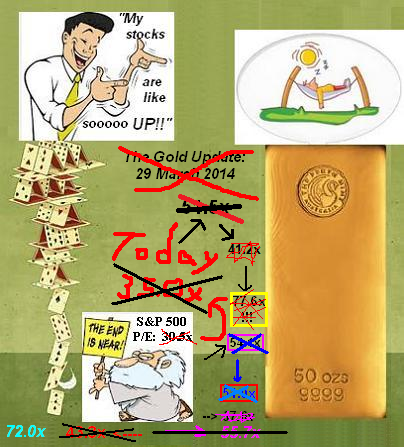
As we opened, hopefully we’re wrong about “Still Lower Gold Ahead”, albeit it can be tough to fight both the war and the Fed. But that said, make sure you’ve Gold as an investment stead!

Comments
Log in or sign up to join the conversation.