

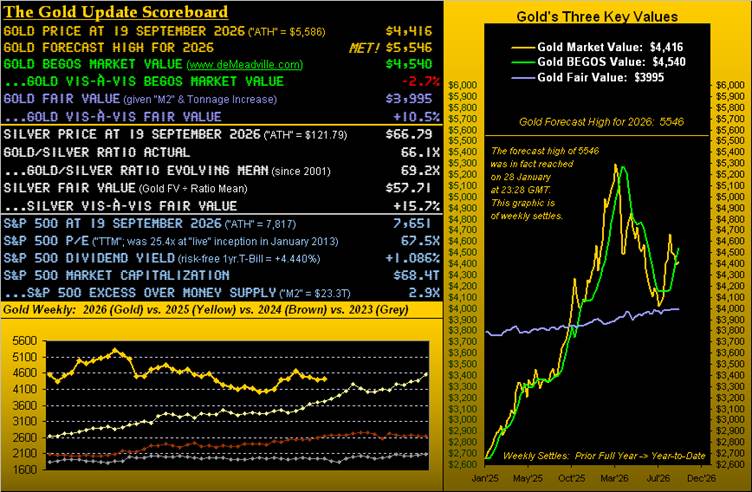
We open courtesy of “The Bob Hope Dept.” with this comedy classic: “Boy, Did I Get a Wrong Number!” –[United Artists, ’66]. For a week ago, upon Squire asking us if the Federal Reserve would raise rates, we thus did state: “No change in rates“. Our notion was — the Fed always being late — that its favoured inflation gauge (Personal Consumption Expenditures) was just a brief ten trading days hence, not to mention the media-portended political ire a rate hike would inspire. Thus, to ensure, let one more meeting endure. “Wrong!”
The market being never wrong and having already priced in the rate hike — all 12 Federal Open Market Committee members voted alike. And given our having “pounded the table” for some two years that a hike was requisite, we are pleased they did it. As for any political ire, immediately after, the President — whilst a bit dour — nonetheless said of FedHead Kevin “The Warrior” Warsh: “We’ve a good man over there.” In any event, ’twill be interesting to next see August’s PCE (30 September), which is not expected to be pretty.
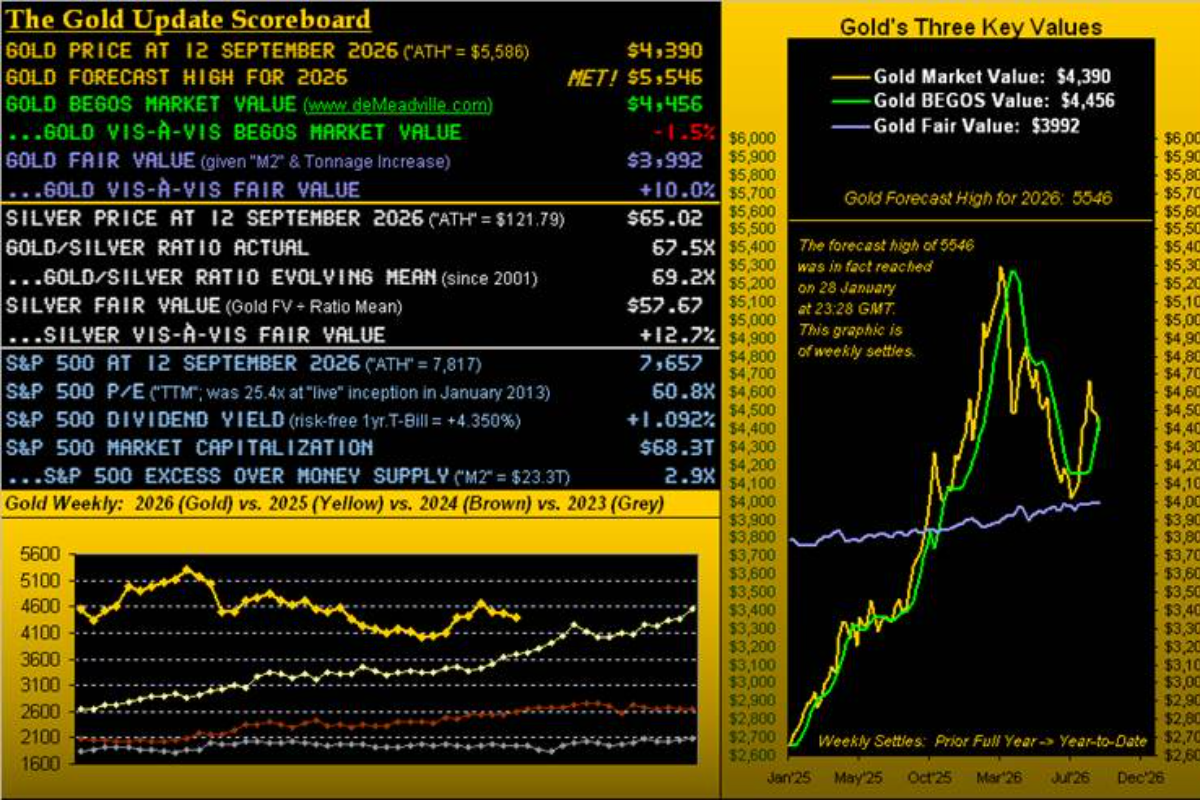
‘Course, as you regular readers know is our wont, rather than watch the FinMedia, we instead actually read the FOMC Policy Statement, the eye-catching sentence this time ’round being: “Economic activity is expanding at a solid pace.“ Albeit two days post-Statement, the Conference Board yesterday (Friday) released its Leading (i.e. “lagging”) Economic Index instead indicative of shrinkage for August. We’ll view the Econ Baro in a bit, but first let’s get to Gold (GLD) as this missive doth befit. And by the weekly bars from a year ago-to-date, Gold did curtail its three-week losing streak in settling this past one higher (barely) at 4416, +26 points over last Friday’s 4390. Here ’tis:
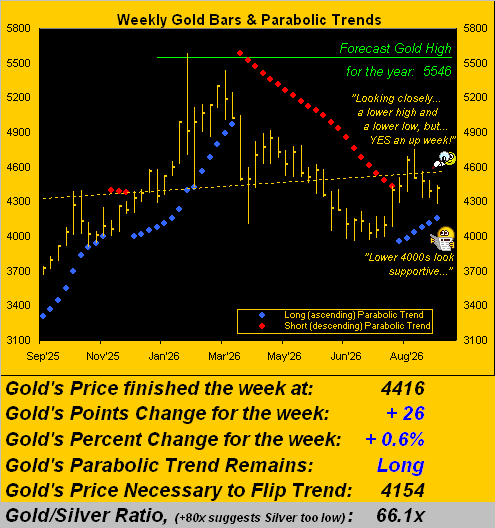
“And, mmb, it finished the week higher than it was before the Fed, even though the buck also went up…”
It does fly in the face of conventional wisdom, Squire. At the very instant just before the release of Wednesday’s FOMC Policy Statement, Gold was 4399, and the Dollar Index 99.42; from there, both were higher come Friday’s close at 4416 and 99.95 respectively. Obviously the Dollar got the bid as post-Fed it pays more interest … but this time not at the net expense of Gold (which, as long-time readers know, plays no currency favourites).
So: shall Gold’s parabolic up streak survive another week? Per the above graphic, the flip-to-Short level for the ensuing week is 4154, -262 points below present price. The expected weekly trading range high-to-low (or vice versa) is 224 points, leaving little room for a straight-down week.
However, we sense the buyers are lurking out there. Gold’s last ten trading days have recorded four up and six down. But the median contract volume for the four up days exceeded that of the six down days by +27%. That is called “positive moneyflow”. Lurking buyers, indeed.
But wait, there’s more. Direct from the website, we’ve constructed a two-panel graphic of Gold by the day from three months ago to date. On the left is price vis-à-vis its smooth BEGOS valuation line: by the oscillator, Gold may be poised to soon pass up through valuation, which across the past 25 years is a proven upside signal for still higher levels near-term. On the right we’ve Gold astride its Market Magnet, for which the interpretation is the same: price piercing above the Magnet (as has just happened) is indicative of further buying:
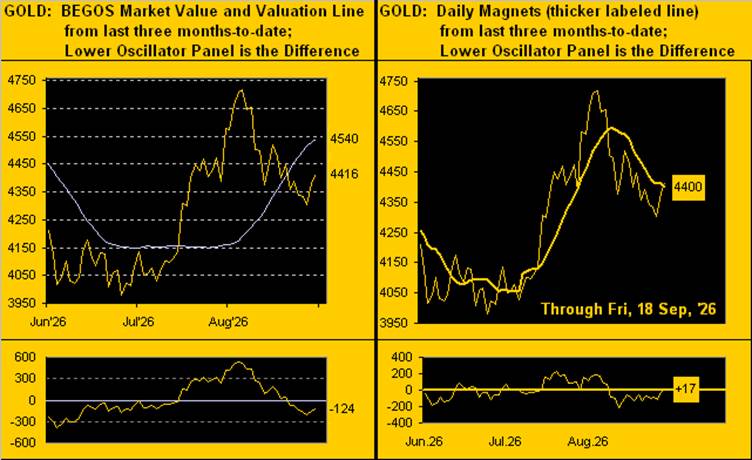
From the cautionary side, as we’ve been saying since the onset of the USA/IRN war, that continues to be the wildcard given a restrictive Oil supply commanding more dollars, by which Gold tends to somewhat succumb. All that noted, are we staying with our 4959 target? As long as (pun intended) “Long” remains the status of the aforementioned weekly parabolic trend, absolutely. And again, as we say, a substantive up week would more comfortably keep that in play.
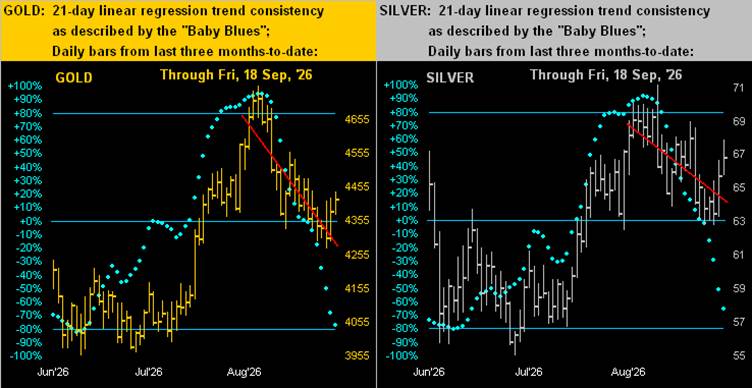
Which brings us to our next two-panel graphic of the daily bars, again from three months ago to date for Gold at left and for Silver (SLV) at right. The key feature therein is the baby blue dots of 21-day linear regression trend consistency. The declining red line in both panels is that trend. And as the “Baby Blues” continue to drop, the red trendlines become increasingly negative. Our time-honoured adage of “Follow the Blues instead of the news, else lose yer shoes” has naturally been spot on during this last month of price decline. Yet both metals during the past week deviated above the respective trendlines. But might that be “A Bridge Too Far”? –[United Artists, ’77]. For the Bulls to break through, we desire seeing the still-falling Blues returning to rising, which combined with the previous Gold panels of both its BEGOS Market Value and Market Magnets appearing more positive ought well elicit higher prices:
Moreover, by their 10-day Market Profiles, both Gold (below left) and Silver (below right) have recovered off their recent lows, overhead resistance not appearing as daunting as we’d lately been seeing. This, in turn, is why the precious metals Market Magnets (born of the Market Profiles) have improved their stance of late in defining price consensus across the past two weeks. Current Profile supporters and resistors are as labeled:
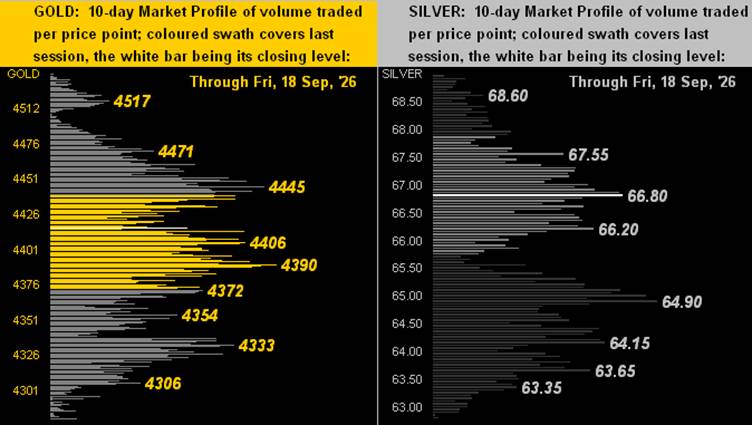
The point is: all of these leading deMeadville metrics are near to churning favorably for Gold, especially were the war to quickly wind down (albeit doubtful) and the August PCE come in Fed-friendly (also doubtful).
Speaking of the Fed, lets now go to the Economic Barometer. Embedded therein is the FOMC Policy Statement quote of earlier note vis-à-vis the actual state of the blue Baro line:
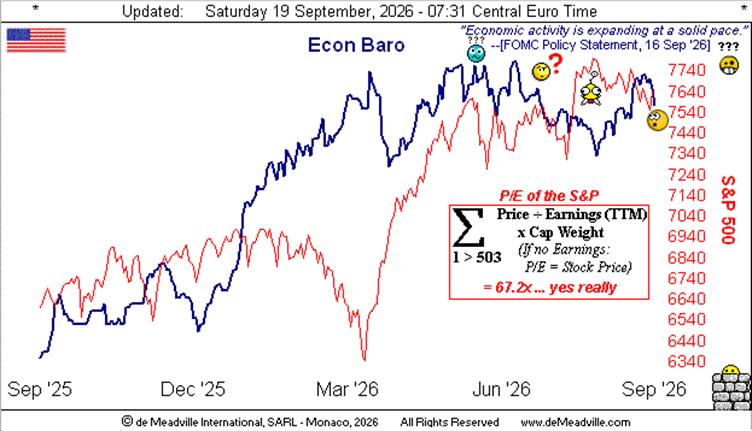
For this past week alone, 15 metrics came into the Econ Baro, of which only five improved period-over-period. (Again, given the Fed’s being “behind the curve”, they likely shan’t figure that out until their 27/28 October meeting). Nevertheless stated, August’s Retail Sales were the best of the incoming bunch; but Building Permits slowed, and July’s Business Inventories suffered their biggest month-over-month backup swing since those from COVID-stricken December 2021 (meaning product on balance wasn’t moving).
“And that S&P (SPY) P/E of 67.2x is nuts, mmb!”
Squire, we yet again queried “AI” (“Assembled Inaccuracy”) with the exact formula, and per usual, it came up with an excuse, this time being: “I have investigated the available data sources, but I cannot yet produce a reliable calculation for all 503 constituents as of September 18, 2026.” (For those of you scoring at home, all you need is an Excel worksheet incorporating for each constituent its current price, trailing 12-month earnings, and current market-capitalization weighting within the S&P. ‘Tis so easy, a WestPalmBeacher can do it … well, maybe not…)
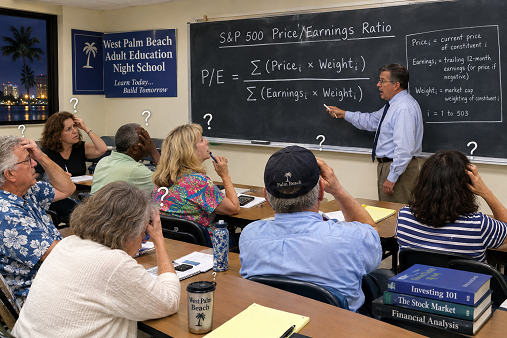
Of greater import is a better up week for Gold about to unfold? Either way, ‘tis Gold one wants to hold!

Comments
Log in or sign up to join the conversation.