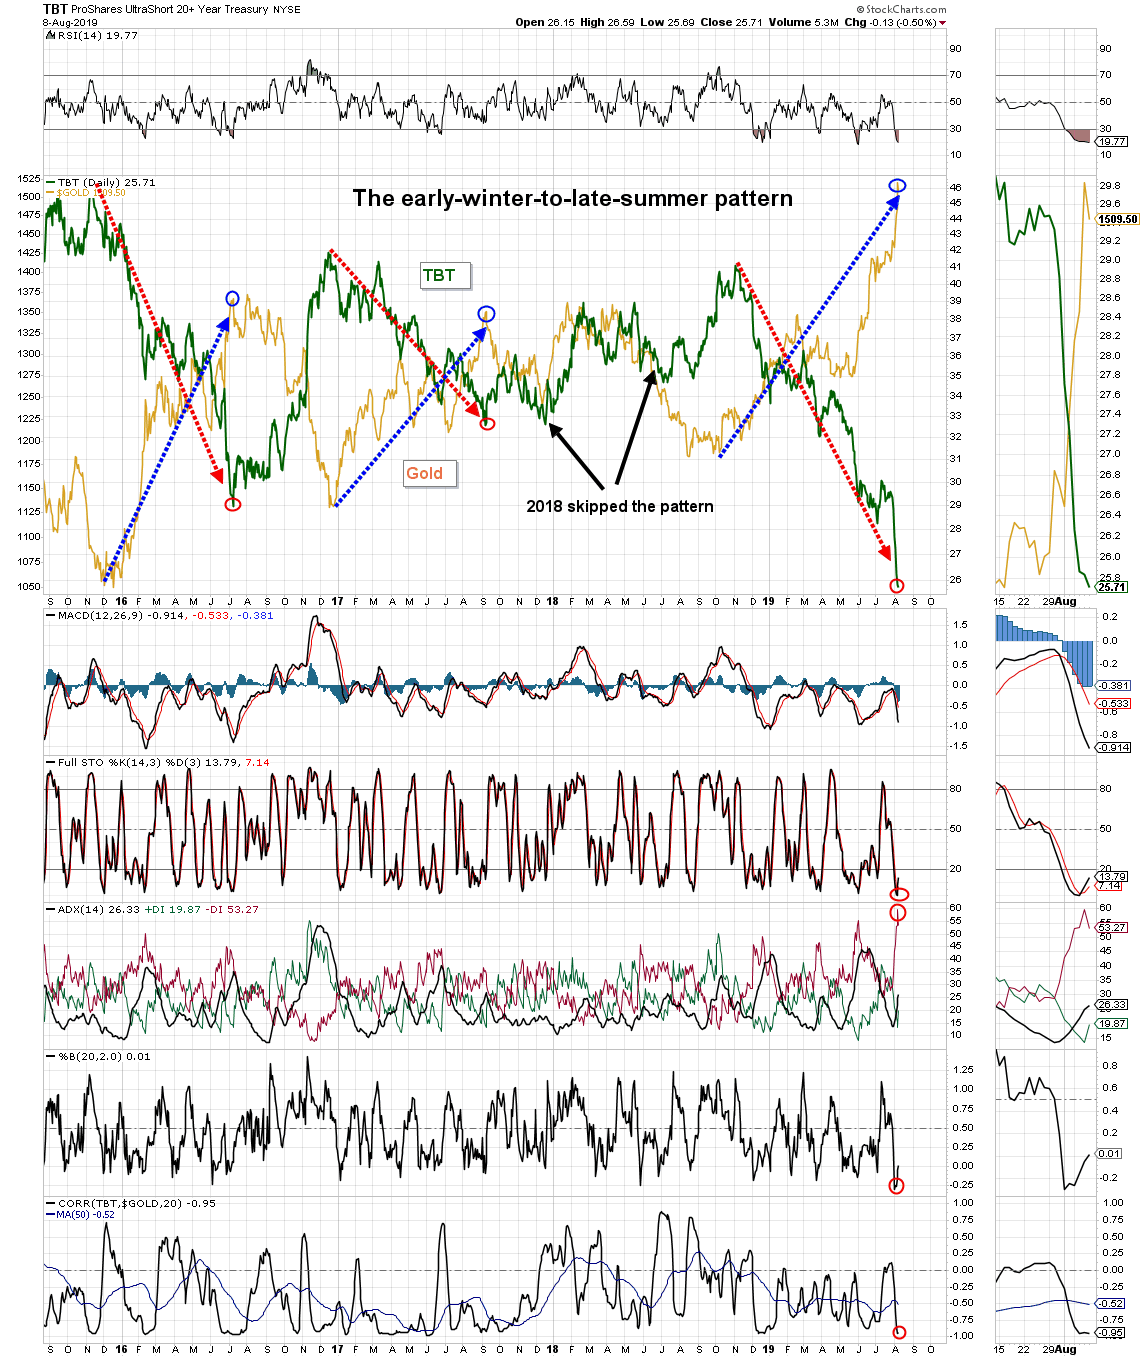
TBT tracks bond rates, which is the inverse of bond price. The chart below highlights the pattern of decreasing rates and increasing gold price that has occurred between December and August/September, three out of the last four years (2018 skipped the pattern). It is highly likely that we are at, or close to, the bottom of rates (red-oval) and the top of the gold price (blue-oval).
Disclaimer:
ANG Traders makes no guarantees concerning the profitability of our trades. Our trade notification service is not intended as investment advice in any way. It is simply providing information about the trades we ourselves are executing. Always consult a registered adviser for assistance with your investments. ANG Traders assumes no liability for any losses that may arise from replicating our trades.
Disclaimer:This and other personal blog posts are not reviewed, monitored or endorsed by
TalkMarkets. The content is solely the view of the author and TalkMarkets is not
responsible for the content of this post in any way. Our curated content which is
handpicked by our editorial team may be viewed here.





Comments
Log in or sign up to join the conversation.