


The end of the current bull market will come when interest rates rise too high for private debt to be serviced. In the year 2000, 6-month T-rates rose above 6% and private debt maintenance snapped causing a bear market. This time around, rates above 5.5% on the 6-month T-rate could cause the break.
The pattern of SPX price, SPX yield, and 6-month T-rate from the late 1990s seems to be currently replicating (black-boxes, below).
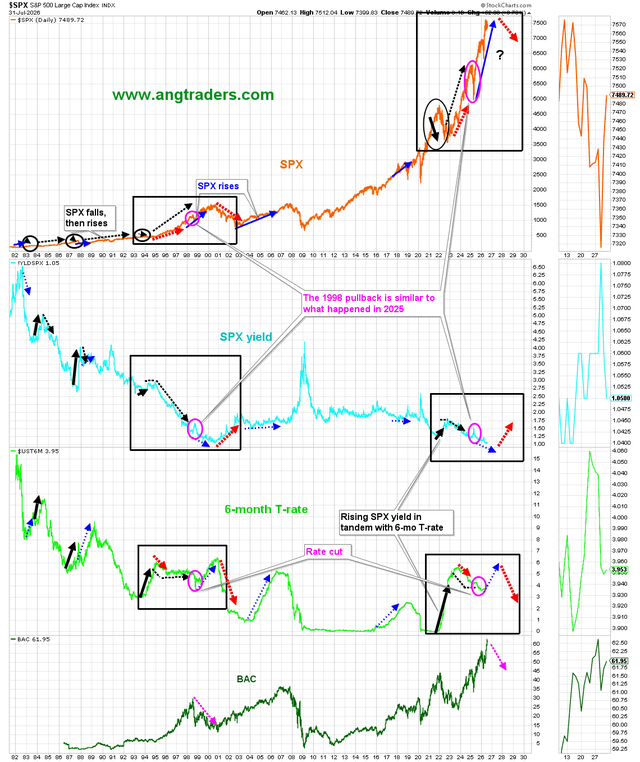
The next two sets of charts show an impressive similarity between the 1990s and the 2020s.
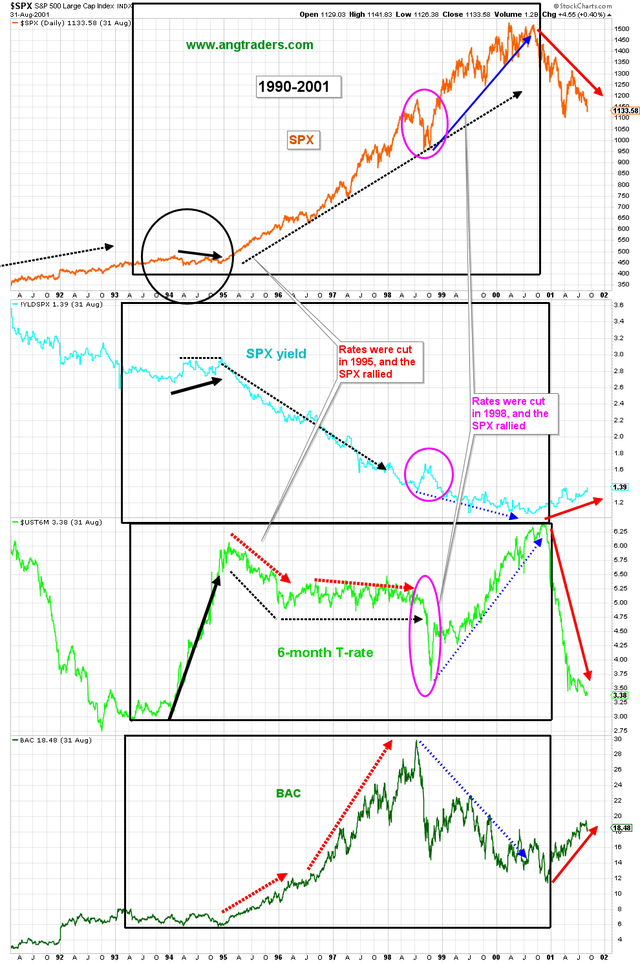
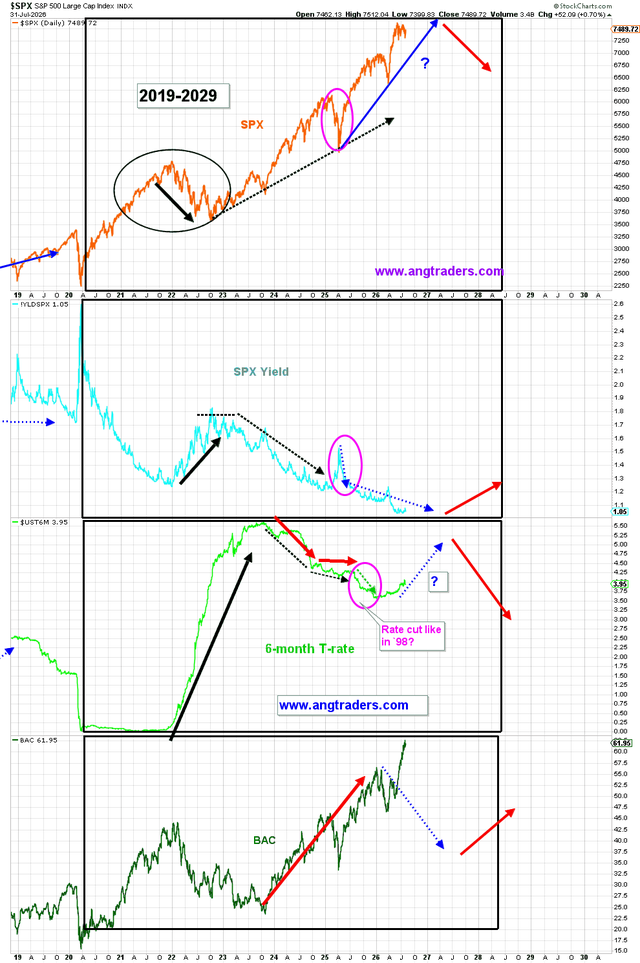
The 6-month T-rate has been creeping higher since the start of the calendar-year, but the fact that BAC is rallying makes me think that rates are not going above 5.5% anytime soon.
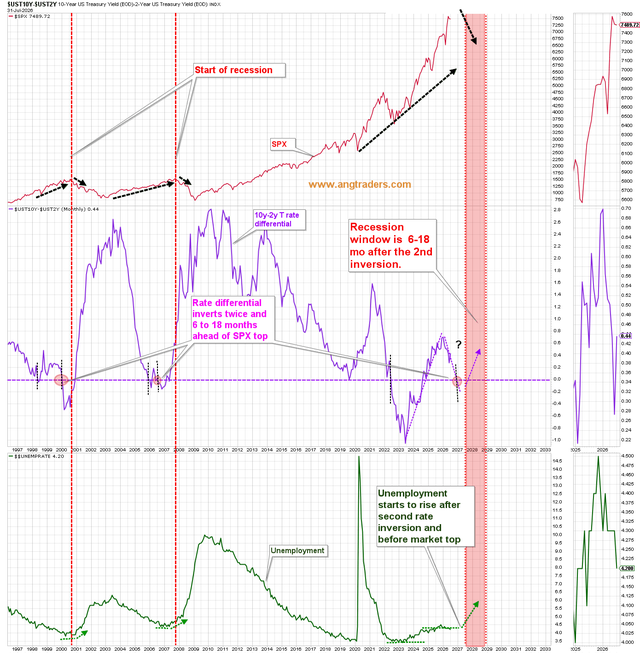
The 10y-2y rate differential has to invert (for the second time) 6-18 months before a bear market starts (chart below). At the current rate, the window for a recession/bear market opens in mid-2027.


Comments
Log in or sign up to join the conversation.