


Gold price (XAU/USD) rises to near $4,180 during the early Asian session on Friday. The precious metal rebounds as US Treasury bond yields retreat from multi-decade highs. However, the potential upside might be limited amid lingering inflation concerns from elevated energy costs and the prospect of higher US interest rates.
The US 10-year Treasury yield, a yardstick for global borrowing costs and asset prices, eased to 5.24% afterspiking earlier in the session to 5.34%, reaching a new multi-decade peak. The 30-year Treasury bond yield similarly hovered near levels not seen in 24 years before moderating into the close.
“Geopolitical uncertainty, particularly around the stalled US-Iran ceasefire discussions, continues to provide a safe-haven underpinning, while higher oil prices remain an inflation risk,” said Manav Modi, commodity analyst Motilal Oswal Financial Services Ltd.
All eyes will be on the US September employment data on Friday, which could offer some hints about the US interest rate path. Economists expect the Nonfarm Payrolls to show an increase of 90,000 job additions in September, versus 162,000 prior. The Unemployment Rate is projected to stay unchanged at 4.1% during the same period.
"Anything that would increase the likelihood of a Fed rate hike would certainly dent sentiment in the gold market. Any additional strong rise in energy prices or any escalation in the Middle East would also do the same," said David Meger, director of metals trading at High Ridge Futures.
Markets are now pricing in nearly a 24.9% chance of a Fed rate hike in October and a 79.4% odds of an increase in December, the CME FedWatch Tool showed.
Gold softens as elevated US real yields and PCE revisions temper inflation narrative
According to analysts at UOB Group, “Gold spot reversed earlier gains – which saw it trade as high as $4,219/oz – to close 0.6% lower at $4,157/oz as elevated real yields continued to cap the bullion's upside.” On the macro side, UOB Group notes that “US headline PCE rose 0.3% m/m in Aug, in line with estimates, while the y/y rate fell to 3.4% from 3.7% in prior month,” adding that recent “BEA methodology revisions improved the optics but did not materially alter the underlying inflation narrative.”
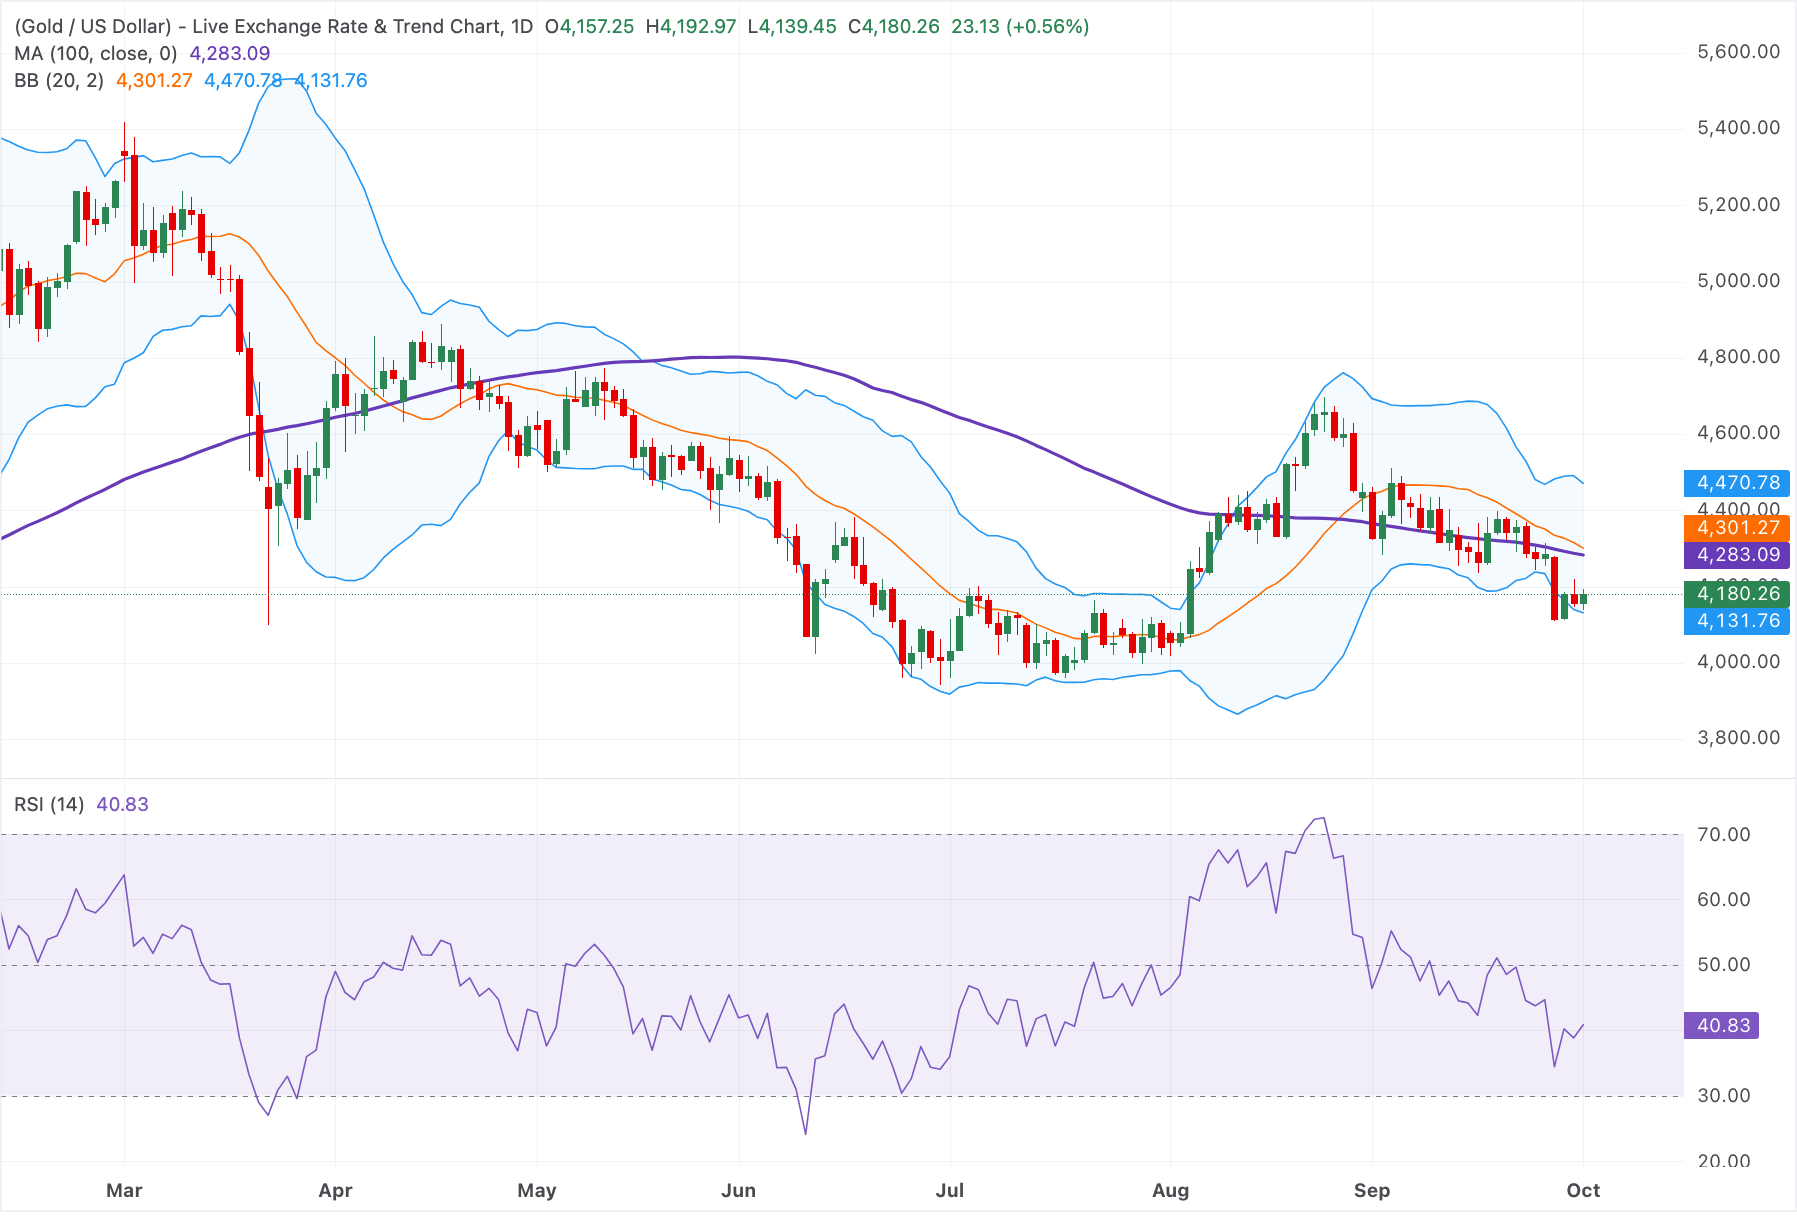
Technical Analysis: Gold retains a negative outlook below the 100-day SMA
In the daily chart, XAU/USD maintains a bearish near-term bias as price holds below the 100-day moving average (MA) and the Bollinger Bands’ 20-day simple moving average (SMA). The metal is hovering closer to the lower half of the Bollinger envelope, while the 14-day Relative Strength Index around 40.83 stays in neutral-to-soft territory, which suggests subdued bullish momentum and leaves the downside exposed while these overhead averages cap recovery attempts.
On the topside, initial resistance emerges at the 100-day MA at $4,285, followed by the Bollinger 20-day SMA at $4,300, with a stronger barrier at the upper Bollinger band around $4,470. On the downside, immediate support is located at the lower Bollinger band near $4,130; a sustained break below this band would reinforce the bearish bias and open the door for a deeper slide, while a daily close back above the clustered moving averages would be needed to ease the current downside pressure.



Comments
Log in or sign up to join the conversation.