


Gold price (XAU/USD) recovers to near $4,400, snapping the three-day losing streak during the early Asian session on Thursday. The precious metal gains ground amid a weaker US Dollar (USD). Traders will closely monitor the key US inflation data later this week, which could provide fresh clues on the Federal Reserve’s (Fed) next interest rate decision.
Reuters reported on Wednesday that Iran said it had attacked 10 ships near the Strait of Hormuz after the US sank five Iranian oil tankers, in the biggest wave of attacks on shipping by both sides since the start of the six-month-old war.
Renewed tensions in the Middle East and rising oil prices have raised inflation concerns and strengthened the case for the US central bank to hike rates at its policy meeting next week. Higher interest rates typically weigh on gold because the precious metal does not pay interest, making yield-bearing assets relatively more attractive.
Traders brace for the US Producer Price Index (PPI) due on Thursday and Consumer Price Index (CPI) inflation data on Friday. These reports could offer some hints on whether the Fed will hike interest rates to contain price pressures.
The market is pricing in about a 60% chance of an interest rate hike at the central bank’s policy meeting next week, according to the CME FedWatch Tool.
Gold stays data sensitive as US inflation looms large
According to TD Securities, “a stronger jobs report initially weighed on gold,” but subsequent “less hawkish Fedspeak and currency interventions then cooled the narrative,” underlining that the market now has “an elevated sensitivity to incoming data and headlines.” The bank argues that “inflation data is the next big catalyst,” warning that “an upside surprise would embolden Fed pricing and weigh on the yellow metal,” whereas “less worrisome inflation could ultimately be the first catalyst to see the next wave of discretionary positioning start to enter the market.”
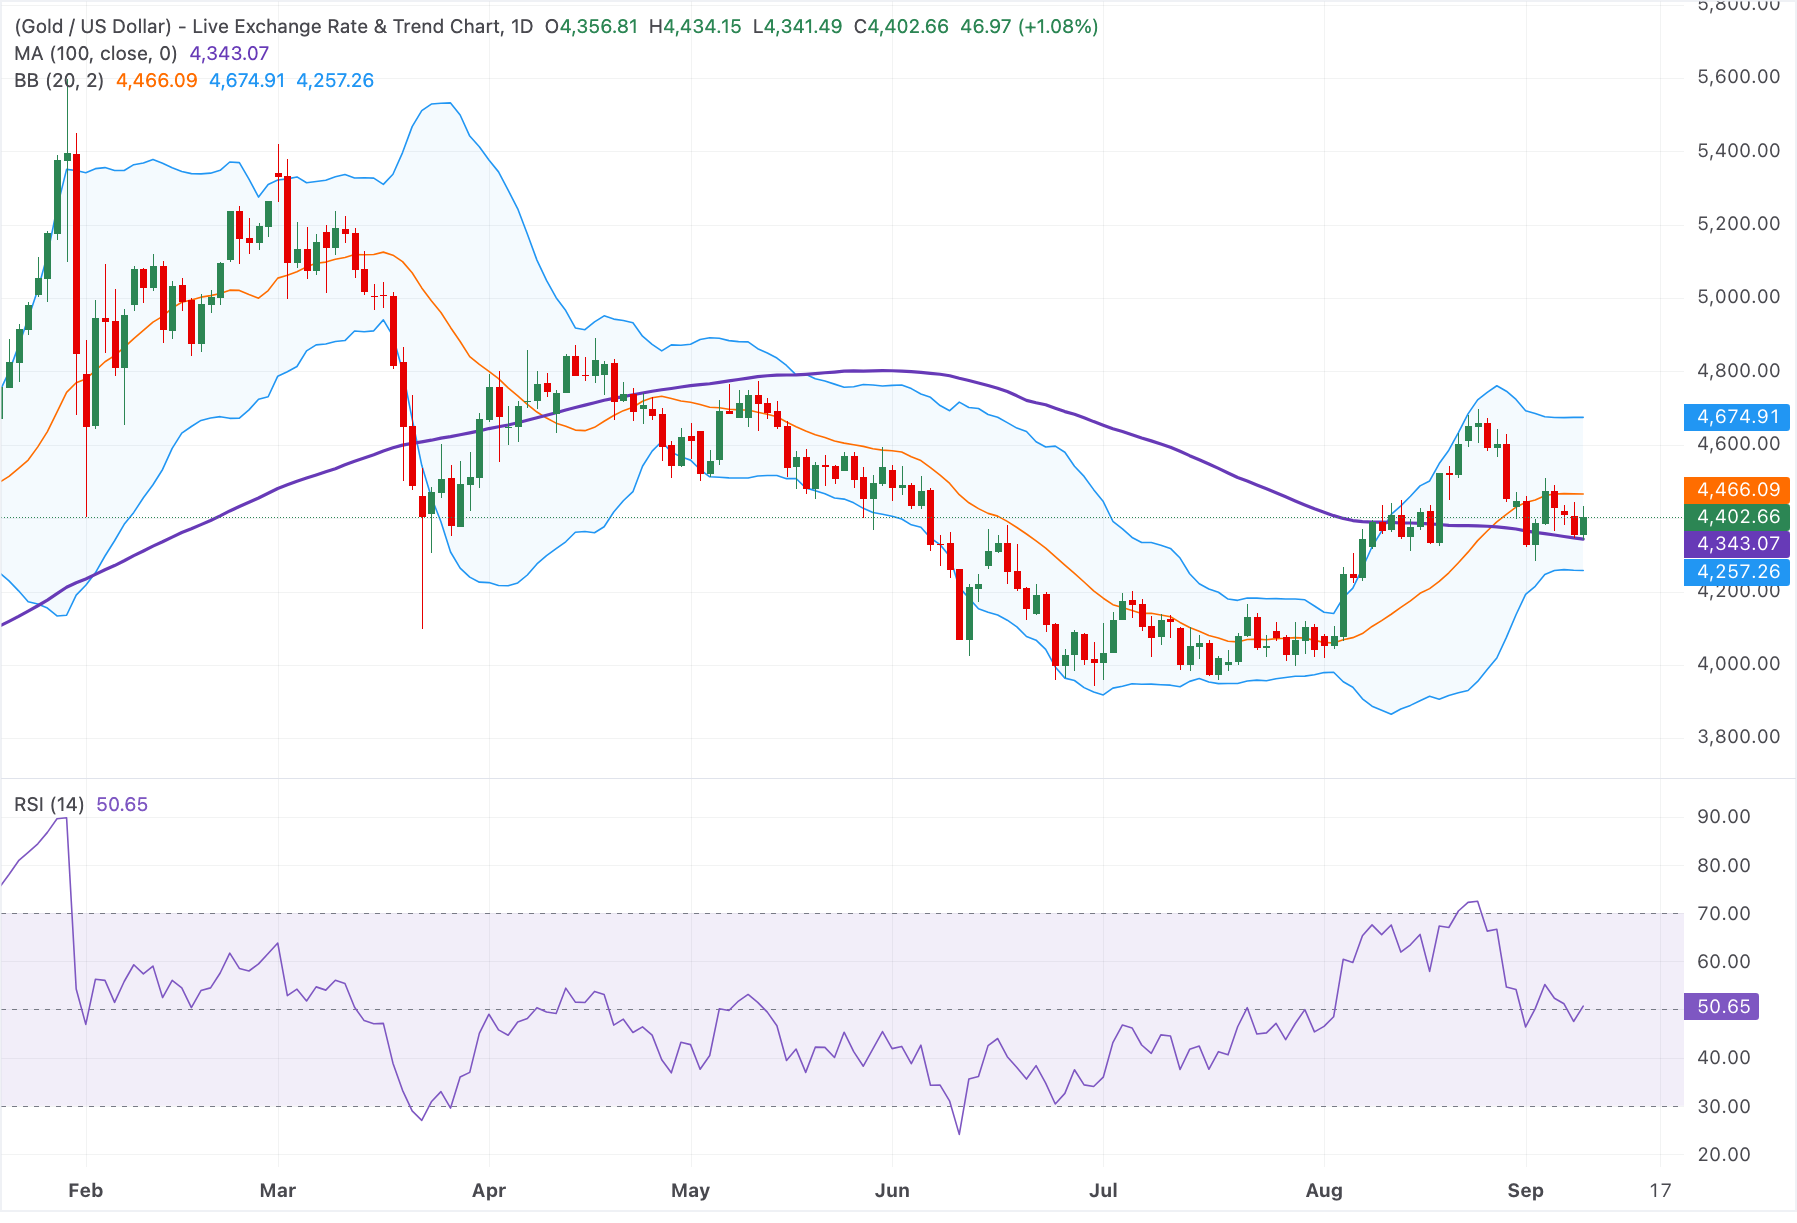
Technical Analysis: Gold remains bullish above the 100-day SMA
In the daily chart, XAU/USD holds above the 100-day moving average (MA), keeping a constructive near-term bias while price consolidates between the Bollinger Bands’ lower band and the middle band resistance. The Relative Strength Index (14) at 50.65 is neutral, suggesting momentum has cooled after recent gains but not yet reversed decisively.
On the topside, initial resistance is located at the Bollinger middle band around $4,465, with a break higher exposing the upper band near $4,675 as the next hurdle. On the downside, immediate protection emerges from the 100-day MA at $4,345, ahead of stronger structural support at the Bollinger lower band around $4,255, where buyers would be expected to reappear on deeper pullbacks.


Comments
Log in or sign up to join the conversation.