


Gold (XAUUSD) prices remained confined near the $4,000 level as markets evaluated geopolitical risks and the interest rate outlook. The conflict between the United States and Iran continued to increase uncertainty, while higher oil prices kept inflation concerns elevated. At the same time, softer US inflation data reduced expectations for an immediate Federal Reserve rate increase. These developments kept gold trading near an important technical support area as markets awaited the next major catalyst.
Gold Price Consolidates as US-Iran Conflict and Fed Rate Expectations Drive Markets
Gold prices continued to consolidate near the $4,000 level while the conflict between the United States and Iran showed no signs of easing. The United States launched another round of military strikes while maintaining its naval blockade around Iranian ports in the Strait of Hormuz. Iran responded by activating its air defense systems and continued targeting US military facilities across the region. The ongoing conflict has increased uncertainty across global financial markets and kept investors focused on geopolitical risks.
The disruption around the Strait of Hormuz has also supported higher oil prices. Elevated energy prices increase transportation and production costs and keep inflation concerns alive. Persistent inflation could encourage the Federal Reserve to maintain a restrictive monetary policy for longer. The outlook for higher interest rates supports the US Dollar and reduces the appeal of non-yielding assets like gold.
Recent US inflation data, however, offered some relief to the precious metals market. Core Consumer Price Index inflation came in below expectations, while Producer Price Index data also showed softer price pressures. These reports reduced expectations for an immediate Federal Reserve rate increase. Market pricing now points to lower odds of a July rate hike, although investors still see a meaningful possibility of policy tightening later in the year. Attention now turns to upcoming US economic releases, which could influence interest rate expectations and determine gold's next move.
Gold Technical Analysis: XAU/USD Approaches Key Triangle Support
The gold chart below shows price trading inside a large triangle pattern. The descending trendline has capped every major recovery since the January peak. At the same time, the lower trendline has continued to provide support. Price has now moved close to the apex of the pattern, showing that volatility continues to contract before the next directional move.
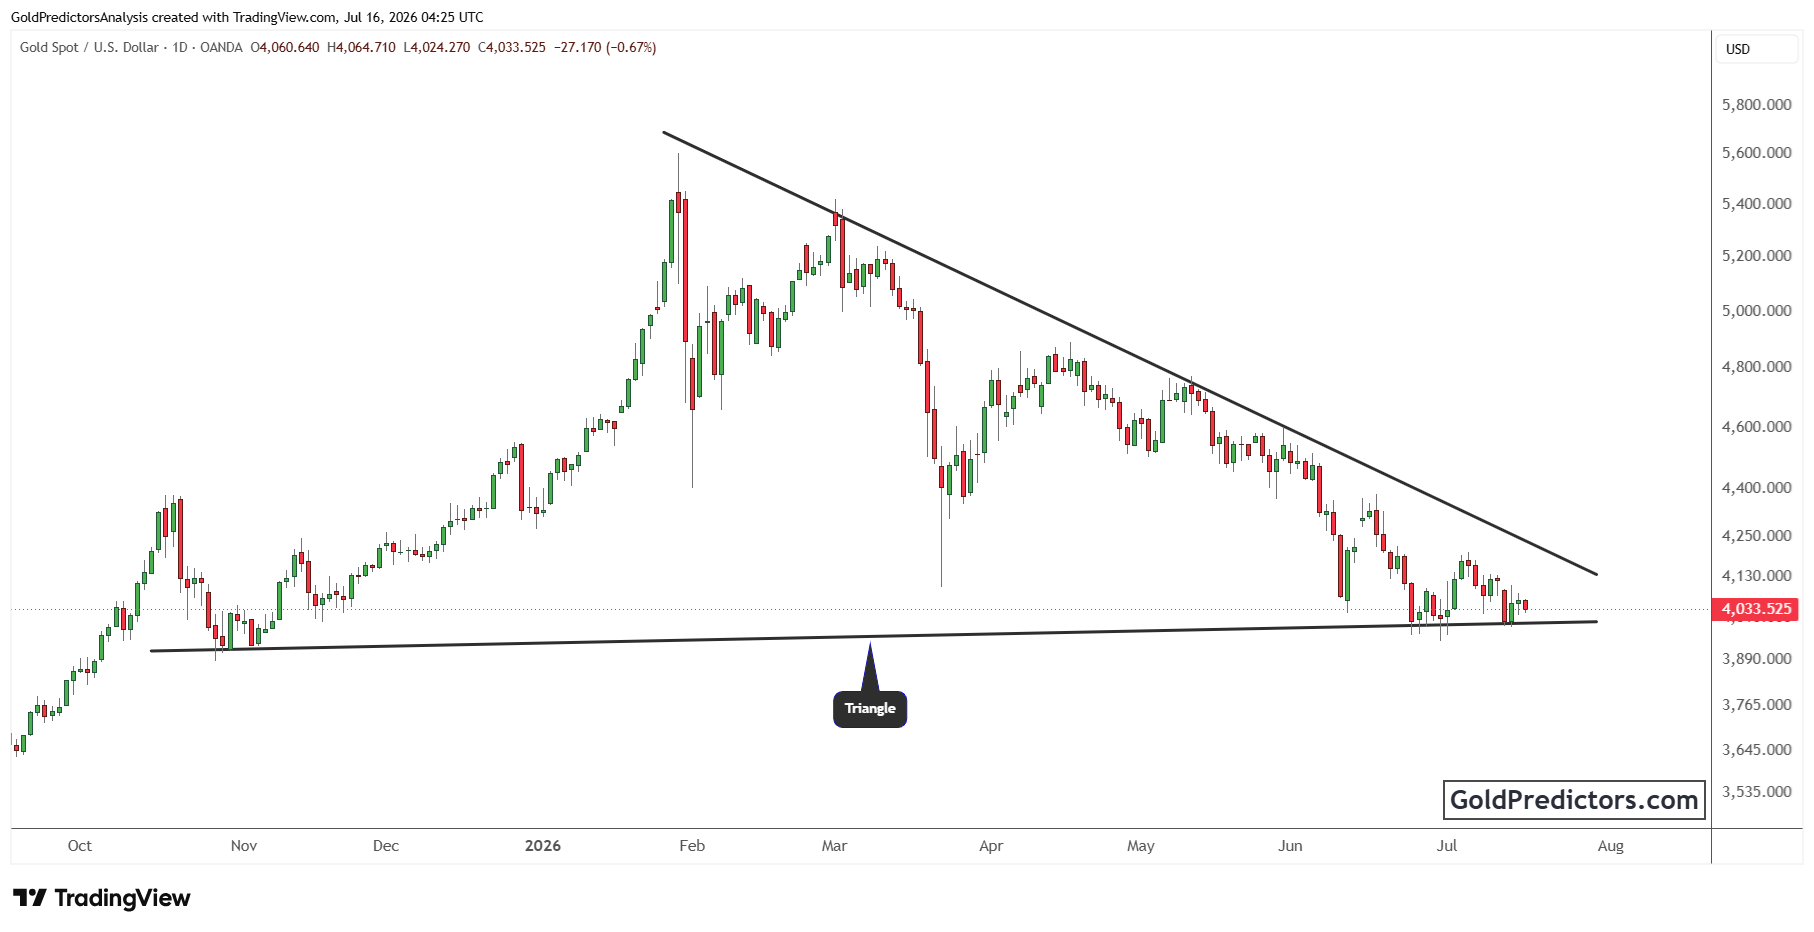
Recent candles show that gold remains under pressure after another rejection from the upper boundary of the triangle. Repeated rejection from the descending trendline has kept the broader corrective structure intact. However, the lower boundary has prevented a deeper decline on several occasions. This repeated reaction confirms that both trendlines remain technically important.
Gold is now trading very close to the triangle support. Holding above this trendline would keep the consolidation pattern intact and allow another test of the descending resistance line. However, a sustained break below the lower boundary would weaken the current structure and could trigger a larger corrective move. A breakout from either side of the triangle is likely to determine the next major direction.
Gold Outlook: Key Support Holds as Markets Await Fresh Catalysts
Gold prices continue to trade near an important technical support area as markets balance geopolitical risks with changing expectations for US monetary policy. Ongoing tensions in the Middle East and higher oil prices could keep inflation concerns elevated, while upcoming US economic data may influence the Federal Reserve's next policy decision. At the same time, the triangle pattern shows that the price is nearing a key decision point. A breakout from this formation is likely to provide a clearer signal for gold's next directional move.



Comments
Log in or sign up to join the conversation.